Unlocking the Tax Code with RAND's Tax Code Analysis Tool
Research SummaryPublished Mar 19, 2026
Research SummaryPublished Mar 19, 2026
The U.S. federal tax code raises trillions in revenue to fuel the government, but the text itself is a labyrinth of more than 1,900 sections that can obscure the effects of legislative changes. Even small "fixes" to the code can unwittingly cause a ripple effect that leads to unintended consequences. Special interests can also use this complexity to carve out provisions or create tax loopholes that few are likely to notice.
To disentangle the tax code and help policymakers better understand the effects of proposed tax changes, RAND researchers developed the RAND Tax Code Analysis Tool (CAT). Initial analyses run with CAT reveal the relative contributions to revenue from different types of taxpayers and show that adding complexity to the tax system can actually reduce total revenue.
This research brief describes the currently available CAT analyses and showcases details about the tax code that CAT can easily uncover to help policymakers balance competing goals when considering legislative changes. The brief also provides a glimpse into the capabilities of CAT that are possible with additional development.
Part of the RAND von Furstenberg Family Budget Model Initiative, CAT uses an innovative model powered by a graph database of the tax code, which researchers built using natural language processing, network analysis, and other techniques. This graph database provides a mathematical representation of the tax code that quantifies its complexity, finds connections within it, and creates a structure that permits granular examination of tax code sections. CAT allows researchers to store information about large amounts of complex data in a flexible format, enabling them to probe subgraphs to explore data hierarchies and find interconnections quickly and without a lot of computing power (Figure 1).

Researchers produced a graph database of the tax system, in a zoomed-out view, it looks like a giant hairball. But up close, the graph displays the connections (arrows) between nodes (circles). In this simplified example, one tax form contains two form lines that a taxpayer would fill out, and three sections of the tax code refer to those form lines (one section refers to both lines). Nodes can also represent many things, such as entities (e.g., taxpayers, industries) and concepts (e.g., keywords, regulations, types of deductions).
Individual and corporate taxpayers generally interact with the tax system by filling out Internal Revenue Service (IRS) forms that collect the information required to calculate the tax owed. The IRS releases aggregated data on the number of filers who fill out each line of those forms, as well as the total value (in dollars) for each line. By linking these data to the graph database, CAT generated graphs for all connections for both individual and corporate taxes.
The graphs allow policymakers to trace tax incentive programs from an IRS form to the relevant statute, along with all the other sections of a code or regulation that relate to the program, providing powerful information about the implications of proposed changes to the tax code.
The graph in Figure 2 shows all the connections among tax code sections (purple circles), regulations (blue circles), forms (red circles), and form lines (yellow circles) that may affect individual taxpayers. The clusters within this graph show that some forms involve many more regulations and form lines than others.

SOURCE: Analysis of U.S. Code, Title 26.
RAND researchers then connected this information to the aggregated IRS data to produce a proportional map of how money flows through the income tax system. Figure 3 shows the tax system for individuals. The green section represents income. Different types of potentially taxable income enter the graph from the left, yielding the total income among individual taxpayers (almost $15 trillion). Adjustments such as contributions to health savings accounts or alimony payments flow off to the bottom, yielding the adjusted gross income. Standard and itemized deductions flow off to the top (gray), whereas other adjustments, such as tax credits, flow off to the right (yellow), leaving the total amount of taxes generated in blue (about $2 trillion).
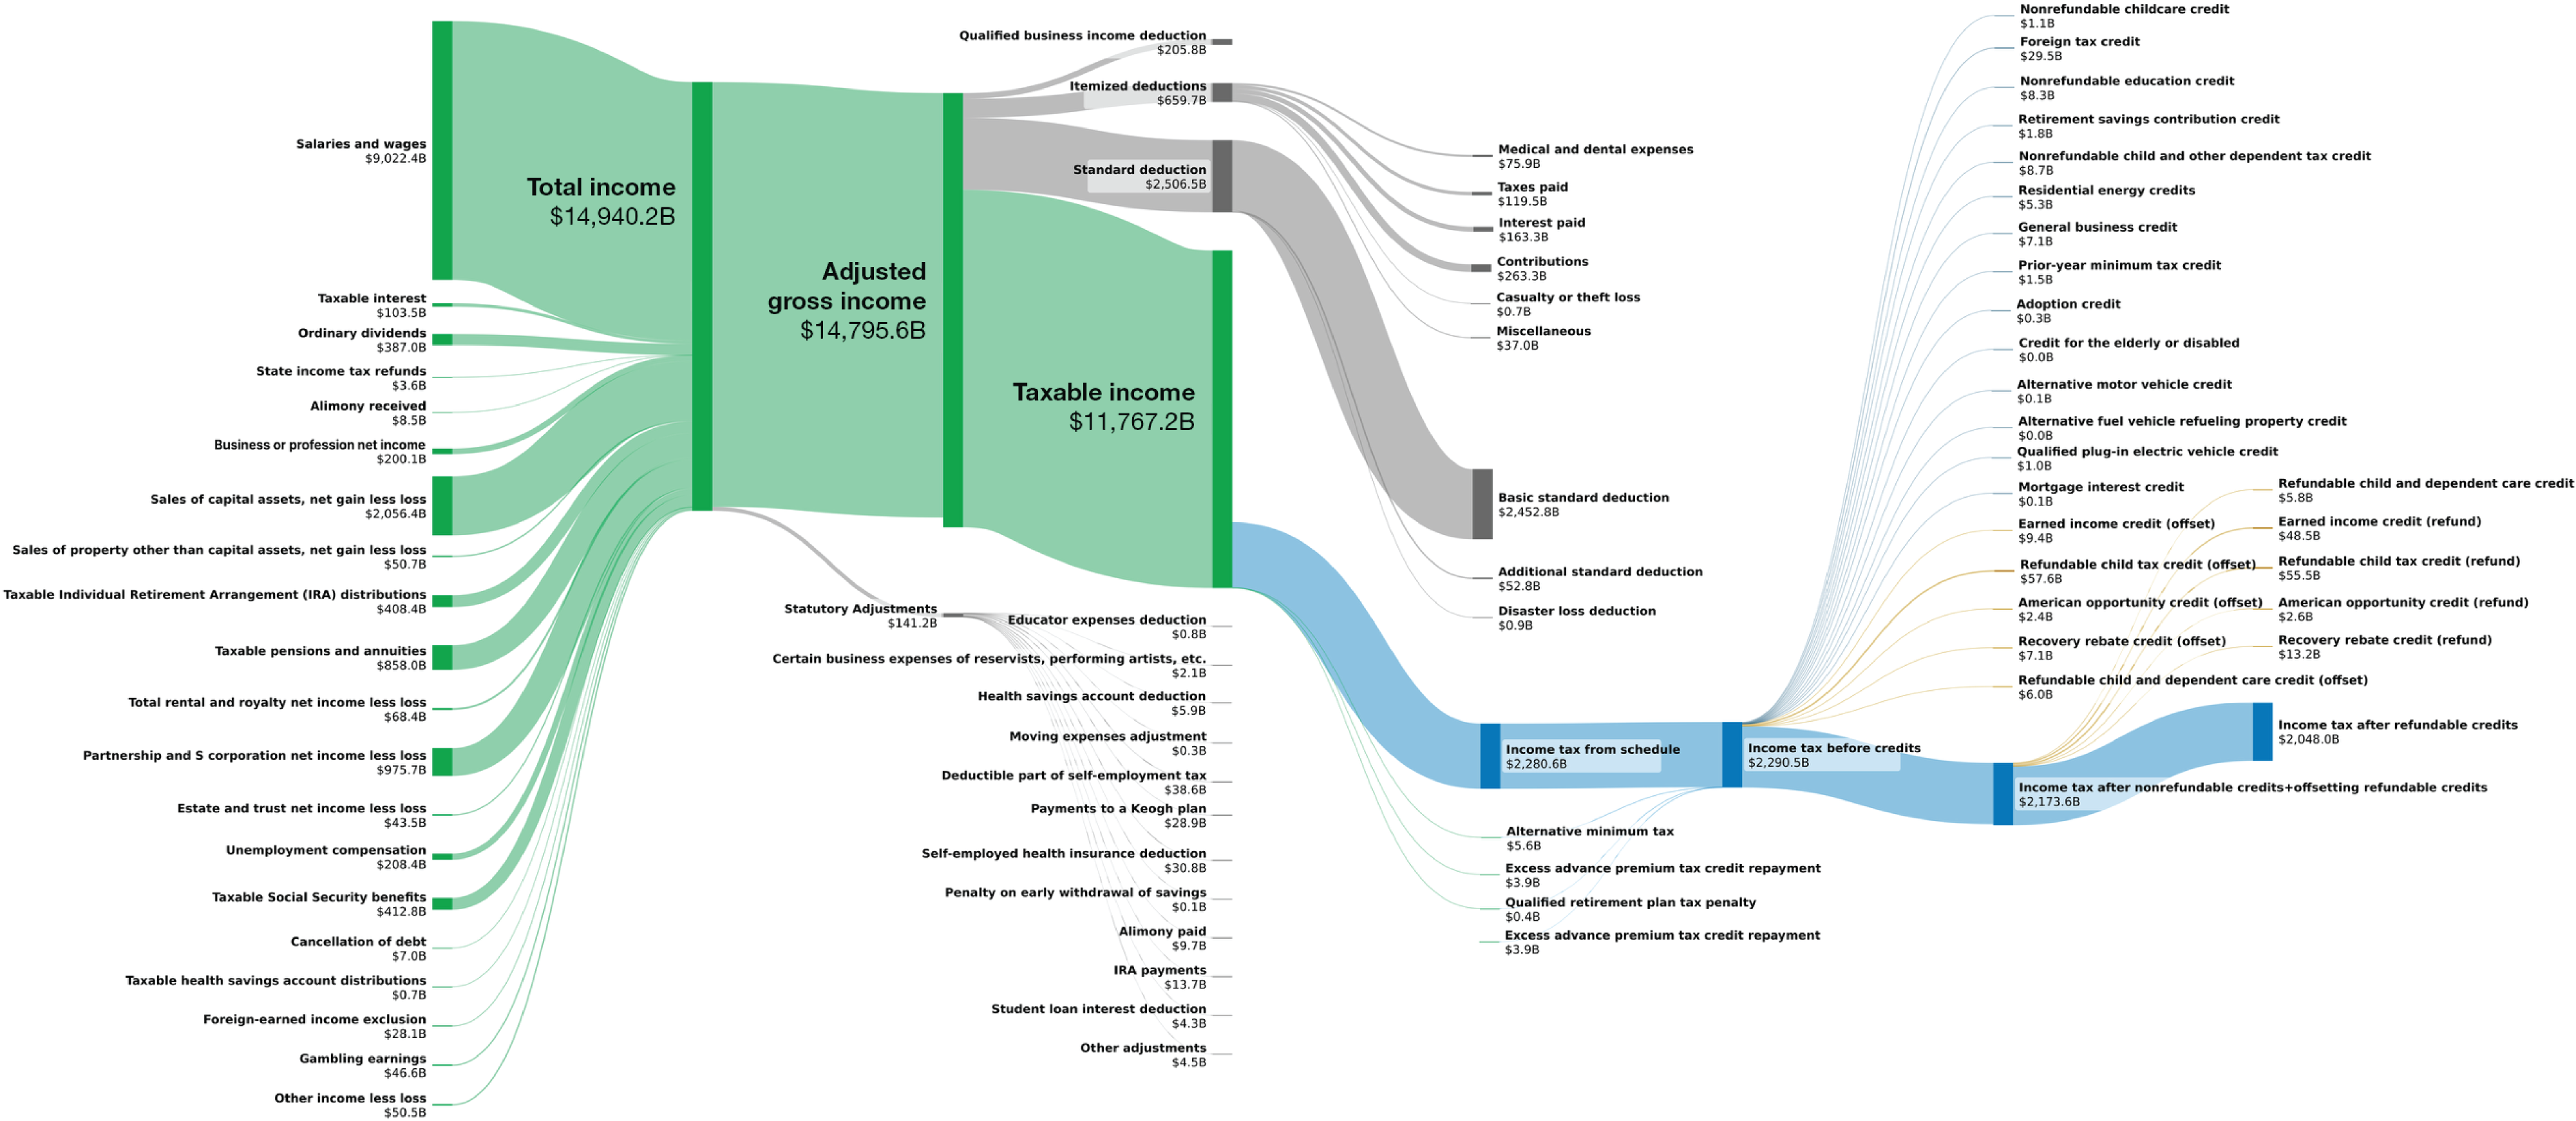
This Sankey diagram illustrates U.S. individual income flow: $14,940.2B total income becomes $14,795.6B adjusted gross income, $11,767.2B taxable income, and $2,320.8B income tax before credits. After deductions and credits, the final income tax after refunds totals $2,137.8B.
SOURCE: Features data from the IRS and the U.S. Department of the Treasury.
NOTE: This figure illustrates the flow of income, deductions, and tax credits as reported on individual income tax returns in 2021. It traces the progression from total income to adjusted gross income, taxable income, precredit tax liability, and final income tax after refundable credits. Flows between income, adjustments, tax liability, and credits are constructed to approximate the statutory sequence of calculations used in determining federal individual income tax liability. The green lines are related to different income measures, the gray lines are adjustments and deductions from income, the blue lines are different tax calculations, and the yellow lines are credits, refunds, and other factors related to the income tax calculations.
This comprehensive mapping not only helps visualize proportions of revenue and deductions but also identifies and quantifies narrow adjustments. The Alternative Fuel Vehicle Refueling Property Credit, for example, involves relatively few filers and had little impact on overall revenue. Likewise, this graph makes it easy to spot large adjustments used by many filers, such as the standard deduction.
Using a similar process, CAT generated a graph of all the connections among tax code sections (purple circles), regulations (blue circles), forms (red circles), and form lines (yellow circles) that may affect corporate taxpayers (Figure 4). Corporations have about 60 percent more form types available than individual taxpayers do, and those forms contain three times as many form lines. The corporate part of the tax code is also substantially more complex than the part for individuals, with about twice as many regulations and sections for corporations.

SOURCE: Analysis of U.S. Code, Title 26.
Figure 5 shows the flow of corporate tax money. Although the tax code has about three dozen credits and deductions for individuals, there are more than 100 for corporations. Different types of potentially taxable income enter the graph from the left, yielding the total potentially taxable income from corporate taxpayers in green (about $27 trillion). Deductions flow off to the top (red), leaving the total tax revenue (the end of the yellow line) from corporations at about $276 billion — about one-tenth the amount of revenue from individual taxpayers.
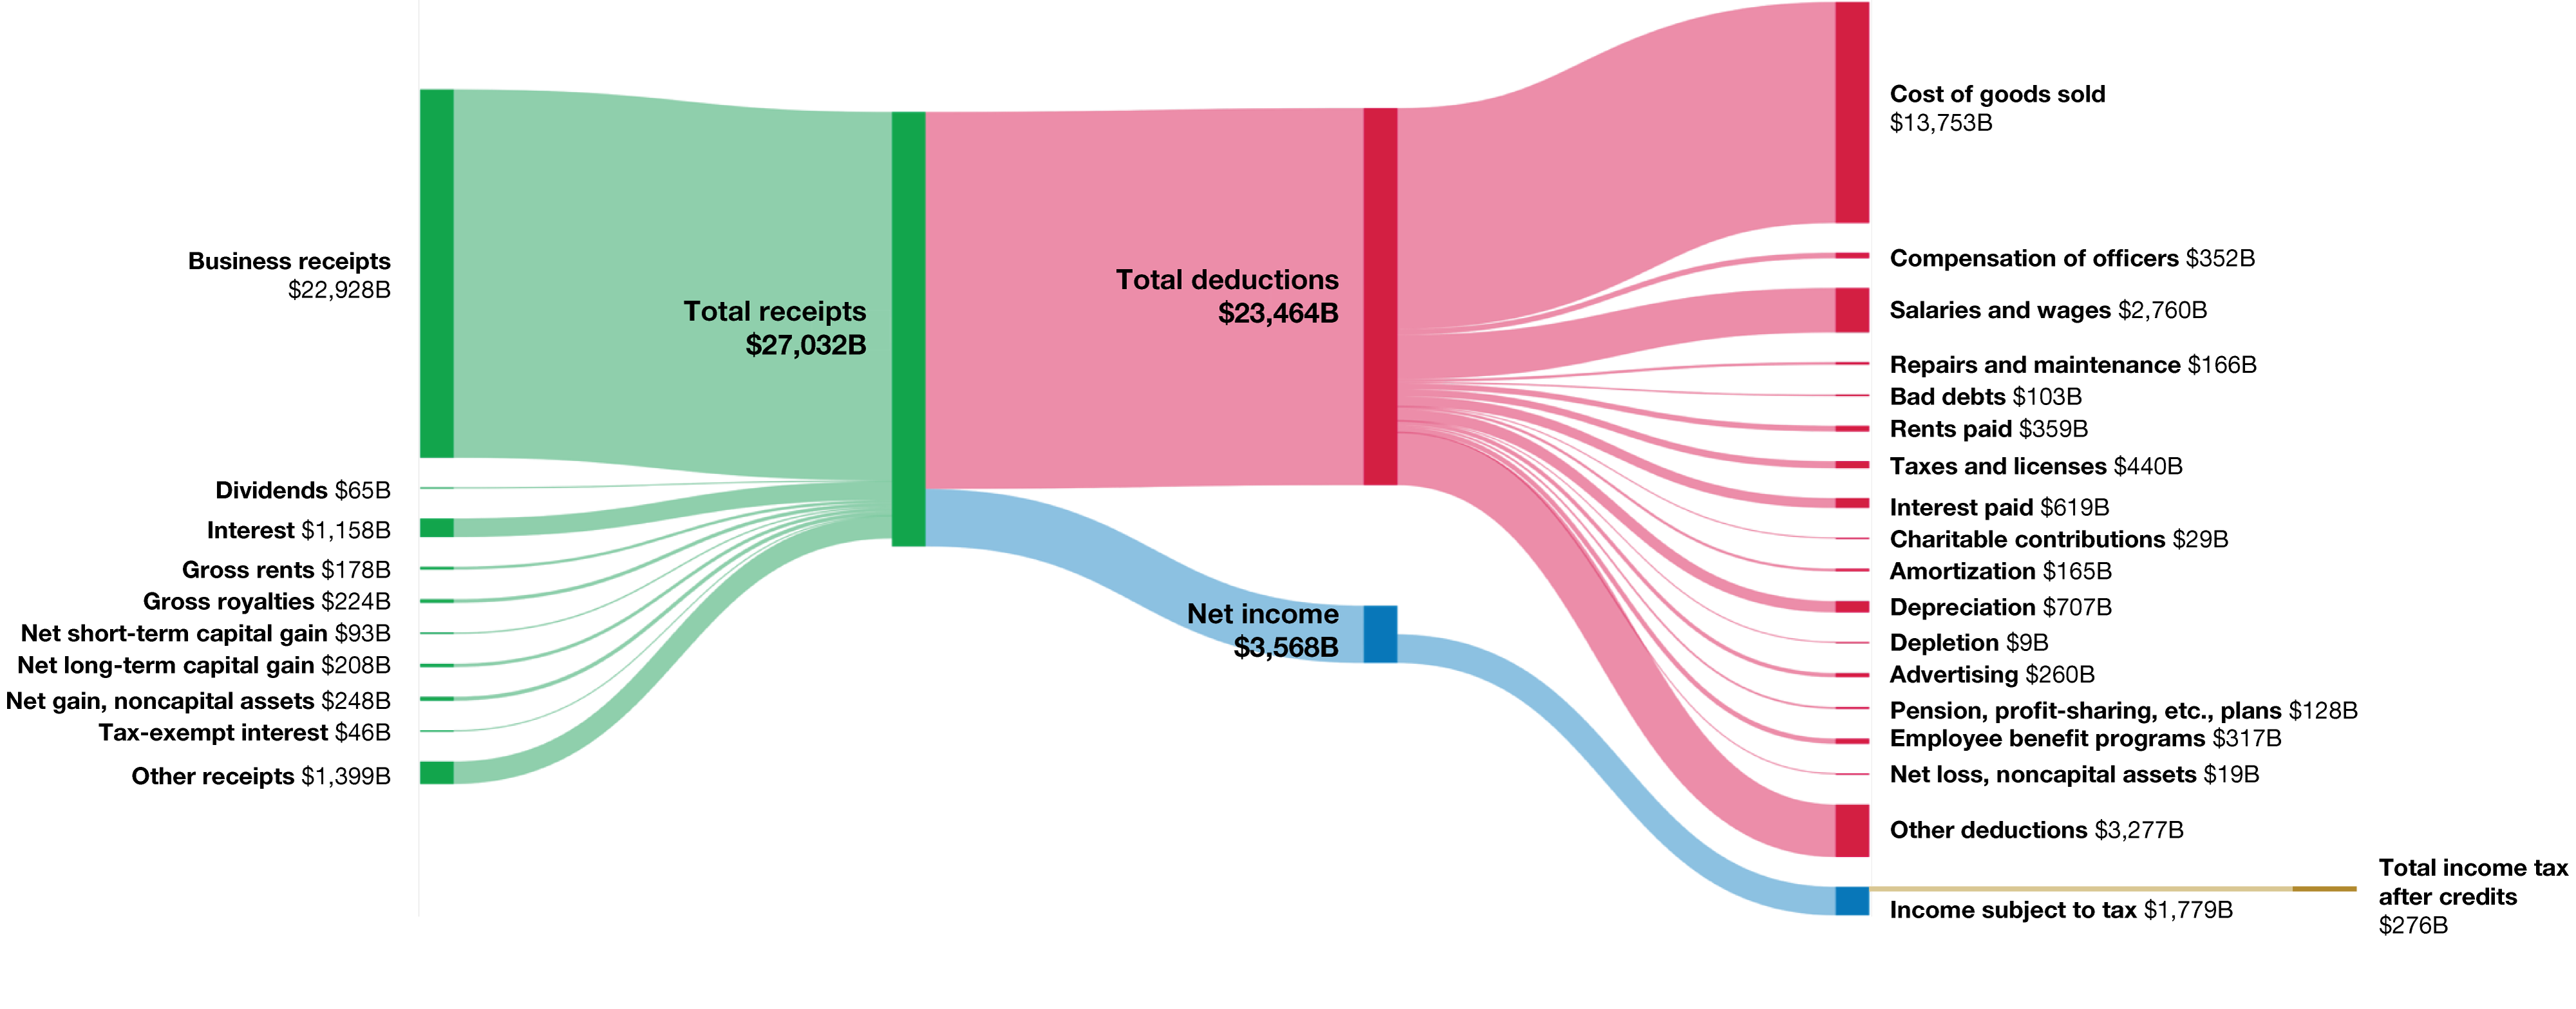
This Sankey diagram shows corporate financial flows: $27,032B in total receipts lead to $23,464B in total deductions, including $13,753B cost of goods sold, resulting in $3,568B net income and $1,779B taxable income after credits of $276B.
SOURCE: Features data from the IRS.
NOTE: This figure shows the flow of receipts, deductions, and adjustments that determined corporate taxable income and final income tax liability for corporations in 2020. It visualizes how gross receipts are reduced by allowable deductions and how statutory adjustments further shape the amount subject to tax. These items are shown as follows: Different revenue and receipt types for corporations are on the left (green lines), various deductions are on the right (red lines), tax calculations are at the bottom (blue lines below the deductions), and the final corporate tax collected is on the bottom right (yellow line).
Although the sheer complexity of the corporate tax code makes it difficult to display each deduction, credit, and adjustment to corporate income in Figure 5, the graph database can easily enumerate and quantify the values that correspond to specific form lines. Many are targeted to specific industries, such as the Orphan Drug Credit for the pharmaceutical industry and the Mine Rescue Team Training Credit for the mining industry. Not only do these industry-specific deductions increase tax code complexity, but they also decrease overall revenue from corporations.
Researchers used CAT to dig further into the complexity of the corporate tax code to see how that complexity affects revenue collected from specific industries. For each industry, researchers first calculated the complexity of the tax code (the number of sections associated with an industry). Then they compared that complexity to the effective tax rate by industry (Figure 6).

| Industry | Section count | Effective tax rate (%) |
|---|---|---|
| Accommodation and food services | 8 | 8.00% |
| Administrative and support and waste management and remediation services | 15 | 6.60% |
| Agriculture, forestry, fishing and hunting | 62 | 6.40% |
| Arts, entertainment, and recreation | 14 | 5.10% |
| Construction | 73 | 5.60% |
| Educational services | 36 | 5.20% |
| Finance and insurance | 753 | 5.60% |
| Health care and social assistance | 126 | 7.00% |
| Information | 21 | 10.70% |
| Management of companies (holding companies) | 42 | 9.50% |
| Manufacturing | 330 | 9.60% |
| Mining | 158 | 6.40% |
| Other services (e.g., religious, civic, scientific, societies, charitable) | 72 | 3.20% |
| Professional, scientific, and technical services | 40 | 5.50% |
| Real estate and rental and leasing | 163 | 3.30% |
| Retail trade | 62 | 10.40% |
| Transportation and warehousing | 149 | 10.70% |
| Utilities | 77 | 4.50% |
| Wholesale trade | 78 | 10.30% |
NOTE: The size of each bubble signifies the income tax revenue associated with each industry. The scale was corrected in April 2026 to reflect billions, not millions.
Although manufacturing and finance and insurance were the most complex industries and paid the most in tax revenue, more complexity did not correlate with more revenue. When analyzing the data, higher tax complexity was generally associated with lower revenue, likely because adding credits and deductions is one important source of increased complexity. More analysis is needed to fully understand these relationships.
Researchers also calculated the tax rate by industry and compared it to the number of tax lines associated with an industry. Some industries, such as real estate, rental and leasing, and other services, paid taxes on about 3 percent of their net income, on average. Others, such as wholesale trade, retail trade, transportation and warehousing, and information, paid slightly more than 10 percent. If the effective tax rate on profits for all firms were set at the rate of transportation and warehousing, corporate income tax receipts would be more than 30 percent higher than they are now.
The CAT analyses summarized in this brief can help enhance policymakers' understanding of the relative tax contributions of different types of taxpayers. The analyses also show that making the tax code more complex may actually lead to lower tax receipts because of extensive deductions, credits, and other adjustments. In addition to these analyses, CAT has the ability to zero in on carve-outs, identify which tax code sections are likely to affect many (or very few) taxpayers if changed, and describe the taxpayers most likely to be affected by changes to a particular section.
RAND also continues to expand what CAT can do. Future iterations may be able to
These and other enhancements will elevate CAT to a tax modeling tool with an unparalleled ability to capture nuances of the tax code that matter for fair implementation for all taxpayers throughout the United States.

This publication is part of the RAND research brief series. Research briefs present policy-oriented summaries of individual published, peer-reviewed documents or of a body of published work.
This document and trademark(s) contained herein are protected by law. This representation of RAND intellectual property is provided for noncommercial use only. Unauthorized posting of this publication online is prohibited; linking directly to this product page is encouraged. Permission is required from RAND to reproduce, or reuse in another form, any of its research documents for commercial purposes. For information on reprint and reuse permissions, please visit www.rand.org/pubs/permissions.
RAND is a nonprofit institution that helps improve policy and decisionmaking through research and analysis. RAND's publications do not necessarily reflect the opinions of its research clients and sponsors.

