
Every year, RAND surveys thousands of teachers, principals, and superintendents who are members of the American Educator Panels to keep tabs on what is happening in K–12 public schools. We recently launched an American Youth Panel for people ages 12 to 21 and an American Parents Panel. Together, these panels now allow us to gather a complete set of views from students, parents, and educators on public education.
When we looked back on the last 12 months of reports based on our surveys, these are the findings that told us the most about the state of American public schools.
Chronic Absenteeism Persists in Urban Districts
Chronic absenteeism (defined as students missing 10 percent or more of school days) spiked in the COVID-19 pandemic. Absences have improved since the peak in the pandemic, but they are still above pre-pandemic norms. Our data suggests that continued high absenteeism rates nationally are concentrated in nearly half of urban districts. Our survey data suggest that in the 2024–25 school year, 30 percent or more of students in urban districts missed 10 percent or more school days. Urban districts were roughly five to six times more likely to report such levels of absenteeism than rural and suburban districts.
—Melissa Kay Diliberti
Figure 1: Urban Districts Report Extreme Chronic Absenteeism

| District Subgroup | Low (%) | Modest (%) | Significant (%) | High (%) | Extreme (%) |
|---|---|---|---|---|---|
| Total | 7 | 24 | 30 | 28 | 11 |
| Urban | 0* | 0* | 23 | 33 | 44* |
| Suburban | 8 | 42* | 27 | 16 | 7 |
| Rural | 8 | 19 | 32 | 31 | 9 |
| Low poverty | 11 | 46* | 28 | 15* | 1* |
| Middle poverty | 5 | 19 | 36 | 28 | 12 |
| High poverty | 8 | 10* | 21 | 41 | 20 |
| Majority White students | 10* | 25 | 33 | 23 | 8 |
| Majority students of color | 1 | 19 | 24 | 38 | 18 |
An annotation that encompasses the "Extreme" category of Urban, Surburban, and Rural indicates: "Urban districts were five to six times more likely to report extreme chronic absenteeism than their rural and suburban peers."
NOTE: This figure depicts response data from the following survey question: “What percentage of your students have missed 10 percent or more of school days (i.e., have been chronically absent) thus far during the 2024–2025 school year?” (n = 202). We categorized districts by the severity of their chronic absenteeism levels using definitions from Attendance Works (2024). An asterisk (*) indicates that the subgroup percentage of districts reporting a specific chronic absenteeism severity level is statistically significantly different (p < 0.05) from the remainder of districts not in that subgroup that said the same. The purple box is intended to call attention to the much higher rate of extreme chronic absenteeism reported by urban districts compared with suburban and rural districts.
Losing Interest During Math Class Is a Common Problem
About half of middle and high school students reported losing interest during their math lessons about half or more of the time. That was a striking finding from our survey last year of 724 members of the RAND American Youth Panel who are aged 12 to 21. We also asked students which types of curricular activities they prefer most. Those who were the most prone to disengage in math lessons reported wanting fewer online activities and more real-world applications. Given the fast-changing economy and uncertain job opportunities for this generation, our findings suggest that using teaching methods that convey math's workplace relevance will appeal to those most likely to fall behind.
—Robert Bozick
Figure 2: How Many Students Disengage During Math Lessons?

I lost interest during mathematics lessons.
- Never or almost never: 25%
- Less than half of the time: 26%
- About half of the time: 23%
- More than half of the time: 17%
- All or almost all of the time: 9%
49% lost interest about half of the time or more often
NOTE: This figure depicts response data from the following survey question administered to youths at the time of their AYP empanelment: “How often did you do each of the following in math class in [time period]? I lost interest during math lessons” (n = 434). Youths were asked to select from five responses: “Never or almost never,” “Less than half of the time,” “About half of the time,” “More than half of the time,” and “All or almost all of the time.” The period asked about depended on the youth’s age and when, specifically, they completed the empanelment baseline survey. Youths from ages 12–17 who were empaneled during summer 2024 were asked about their interest in math as of spring 2024 (n = 337); youths from ages 18–21 who were empaneled during summer 2024 were asked about their interest in math during the 2023–2024 school year (n = 9); and all youths who were empaneled in fall 2024 were asked about their interest in math in fall 2024 (n = 88).
SOURCE: Students Lose Interest in Math: Findings from the American Youth Panel
Teachers Feel Unprepared to Instruct Multilingual Learners
About 10 percent of public-school students in the United States are still developing English proficiency and are referred to as multilingual learners, or MLLs. The percentage is even higher in states like Texas or California. Only about half of the teachers we asked in 2024 said they felt prepared to teach MLLs to reach the grade-level standard in their subject. Secondary grade teachers and those at schools with small proportions of MLLs were especially unprepared. These findings indicate that older MLLs and those in schools with smaller populations of MLLs may not be getting the support they need to acquire adequate proficiency in the English language. Who did feel ready to teach MLLs? Those with an English as a Second Language or bilingual credential. This points to a growing need for this kind of training as the nation's student population changes.
—Ashley Woo
Figure 3: Who Feels Most and Least Prepared to Teach MLLs to Grade-Level Standards

| Category | Not at all | Somewhat prepared | Moderately prepared | Fully prepared | Moderately and fully prepared (combined) |
|---|---|---|---|---|---|
| All teachers | 15 | 37 | 35 | 13 | 48 |
| ELA (ref.) | 15 | 37 | 35 | 13 | 48 |
| Mathematics | 13 | 37 | 37 | 13 | 50 |
| Science | 19* | 37 | 33 | 11 | 44 |
| Elementary (ref.) | 12 | 34 | 39 | 16 | 55 |
| Secondary | 19* | 41* | 30 | 9 | 39* |
| No bilingual credential (ref.) | 18 | 40 | 33 | 9 | 42 |
| ESL of bilingual credential | 4* | 34* | 44 | 29 | 73* |
| Serves a small proportion of MLLS (i.e., 1-10%)(ref.) | 23 | 42 | 28 | 7 | 35 |
| Serves a moderate proportion of MLLs (i.e., 11-74%) | 10* | 35* | 41 | 14 | 55* |
| Serves a large proportion of MLLs (i.e., 75-100%) | 5* | 18* | 39 | 37 | 76* |
| Does not use a standards-aligned material regularly (ref.) | 16 | 37 | 35 | 47 | 47 |
| Uses a standards-aligned material regularly | 13* | 36 | 37 | 15 | 52* |
NOTE: This figure depicts response data from the following survey question: “How prepared do you feel to teach multilingual learners to the grade-level standards in [English language arts (ELA)/mathematics/science]?” Response choices included (1) “not at all,” (2) “somewhat prepared,” (3) “moderately prepared,” (4) “fully prepared,” and (5) “not applicable because I do not teach any multilingual teachers.” For ease of interpretation, we excluded the teachers who did not report serving any percentage of MLLs or who responded, “Not applicable because I do not teach any multilingual learners” An asterisk (*) indicates that percentages for that subgroup significantly differ at the p < 0.05 level from the reference group (ref.) before controlling for any teacher- or school-level characteristics. Teachers who reported feeling moderately or fully prepared to teach MLLs are grouped together in this figure to show the total percentage of teachers we interpret as feeling adequately prepared to teach MLLs. N = 7,235.
Job-Related Stress Reported More by Female Teachers
The State of the American Teacher survey has been tracking teacher well-being since 2021. During that time, female teachers have been consistently more likely to report frequent job-related stress than male teachers. But in 2025, the gap between men and women in teaching widened to 22 percentage points—a bigger gender difference than in other professions. The K–12 teaching workforce is about 75 percent female. Millions of students rely on these mostly female teachers to provide not only challenging lessons and insightful feedback, but also social and emotional support. Teachers who are stressed or otherwise experiencing poor well-being may not always be able to give their best effort to their students.
—Elizabeth Steiner & Sy Doan
Figure 4: Frequent Job-Related Stress Rising Again Among Female Teachers

| Demographic | 2021 | 2022 | 2023 | 2024 | 2025 |
|---|---|---|---|---|---|
| Male teachers | 66 | 59 | 46 | 50 | 46 |
| Female teachers | 82* | 78* | 61* | 62* | 68* |
| Male similar working adults | 37 | 32 | 32 | 31 | |
| Female similar working adults | 44 | 49 | 33 | 36 |
Big Jump in Use of Standards-Aligned Materials
For decades, states have tried to get more schools to adopt high-quality instructional materials, or HQIM. The fruit of their efforts is documented in RAND's American Instructional Resources Survey. There's been a steady increase in HQIM use over the last six years. (We ask teachers each year what curriculum materials they use; then we assess whether those materials align to state standards according to the independent assessment organization EdReports, an independent organization that reviews and rates curriculum materials.) In Spring 2024, nearly half of all U.S. teachers reported regularly using a standards-aligned material, a proportion unthinkable a decade ago.
—Julia Kaufman
Figure 5: Teachers Who Use Standards-Aligned Curriculum at Least Weekly
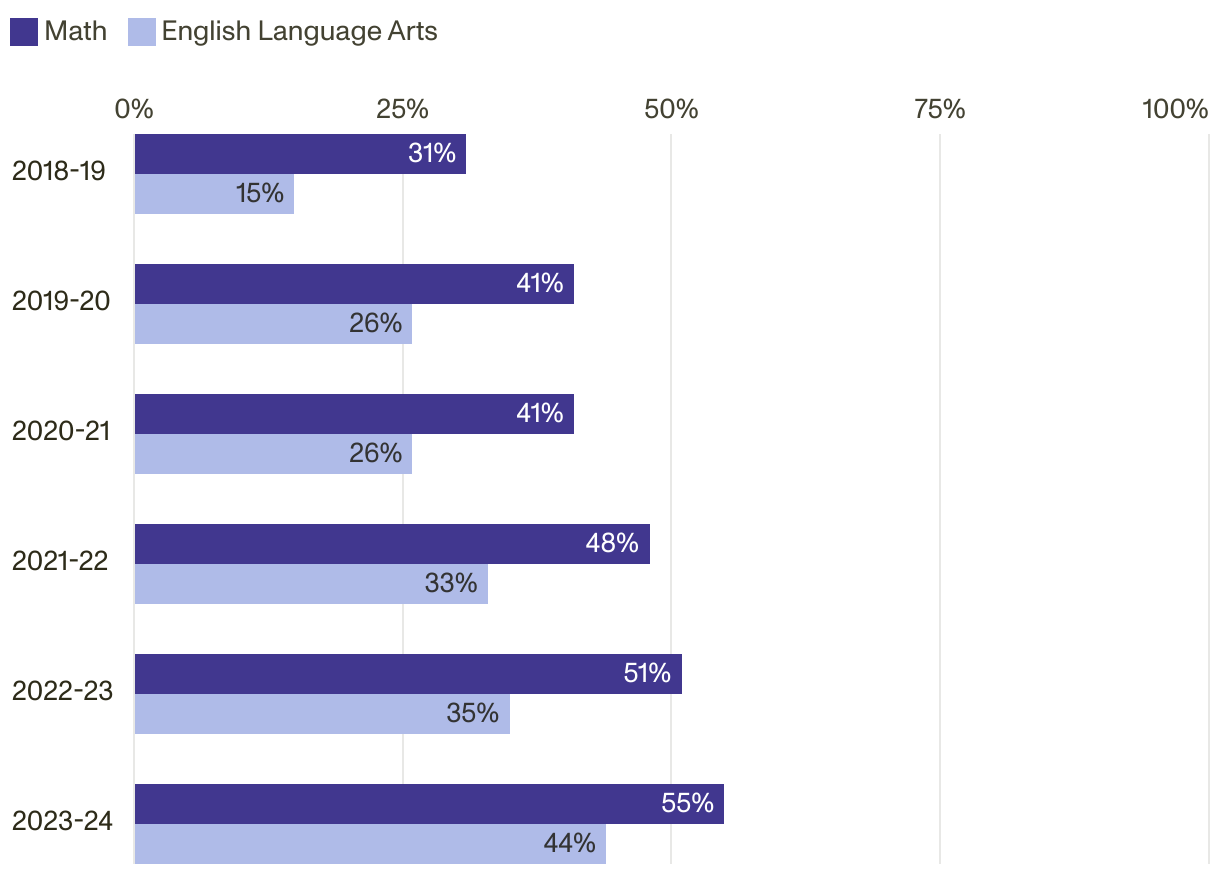
| Year | Math | ELA |
|---|---|---|
| 2019 | 31 | 15 |
| 2020 | 41 | 26 |
| 2021 | 41 | 26 |
| 2022 | 48 | 33 |
| 2023 | 51 | 35 |
| 2024 | 55 | 44 |


