
Research
How Large and Small Districts Develop Their Principals: Selected Findings from the American School District Panel
Sep 2, 2025
Selected Findings from the American School District Panel and the American Youth Panel
ResearchPublished Aug 14, 2025

Photo by Robert Peak/Adobe Stock
Persistent high levels of absenteeism are slowing students’ academic recovery after the disruptions to schooling brought on by the coronavirus disease 2019 (COVID-19) pandemic (Dewey et al., 2025). Even several years after the end of the COVID-19 pandemic, heightened levels of chronic absenteeism continue to be one of district leaders’ top concerns. Four in ten districts identified reducing chronic absenteeism in their schools among their top three most pressing challenges for their schools during the 2024–2025 school year, including 8 percent who ranked this issue as their top challenge. Districts’ concern about chronic absenteeism is on par with their concern about raising math and reading achievement.[1]
Beyond being a persistent challenge, chronic absenteeism levels also continue to be a puzzle. Heightened absenteeism was perhaps not surprising during and immediately after the COVID-19 pandemic, which drastically upended normal schooling conditions. However, it remains unclear why increased absenteeism is still such a large problem for school districts years after the pandemic has ended and schooling routines have returned to prepandemic conditions.
There are many competing and complementary explanations for why absenteeism has remained above prepandemic levels (Mervosh and Paris, 2024). One hypothesis is that families and students became accustomed to districts’ relaxed expectations and revised instructional practices that were implemented during the pandemic; for example, schools might still be providing more-generous makeup windows or allowing students to make up more missed schoolwork online, relative to their prepandemic practices. Specifically, the availability of online materials to replace in-person instruction may have shifted at least some parents’ perceptions about the importance of their children being physically present in school (Diliberti et al., 2024; Saavedra, Polikoff, and Silver, 2024). A second is that many youths are struggling with mental health challenges after the pandemic, and increased anxiety or depression may be the reasons that students are missing more school (Stanford, 2023). Third, parents may be taking illnesses more seriously after the pandemic and keeping their children home for minor issues instead of sending them to school (Diliberti et al., 2024; Vázquez Toness, 2024). Finally, teacher absenteeism has also increased (Hansen, Aggarwal, and Wagner, 2025), which some suspect might make in-person attendance less compelling for students, although recent data have cast doubt on this theory (Jacobson, 2025).
In this report, we investigate the state of chronic absenteeism across the nation as of the 2024–2025 school year. We provide chronic absenteeism levels for the most recent school year using recollections from district leaders, updating our prior work on this topic from the 2023–2024 school year (Diliberti et al., 2024). We also investigate youths’ reasons for being absent from school and consider what strategies districts are using to get students back in school.
To address these questions, we primarily use survey and interview data collected through the American School District Panel (ASDP). The ASDP is a research partnership between RAND and the Center on Reinventing Public Education. The panel also collaborates with several other education organizations, including the Council of the Great City Schools and MGT. In particular, we use data from an ASDP survey administered to 245 K–12 public school districts between March and May 2025.
We weighted these districts’ responses to our survey to make them representative of K–12 public school districts across the country. We caution readers that this is a very small share of the roughly 13,000 school districts located across the United States. Furthermore, although we weighted our small sample of districts to make it representative of school districts across the country at least on such observable characteristics as enrollment size, region, locale, and district poverty level, even our weighted survey sample might not be entirely representative of districts nationally. It is likely that the public school districts that enroll in the ASDP and take our surveys differ from those who do not in meaningful ways that are impossible to measure. We complement these survey data with interviews of 14 leaders of these districts between March and May 2025. Although we interviewed only those who agreed to participate, these data help us better understand and extend our survey results. We also rely on results from an American Youth Panel survey of 1,551 youths, ages 12 to 21, conducted in January and February 2025, which we also weighted to be representative of youths across the nation. More details about our methods are included at the end of this report.
The full set of ASDP survey results can be viewed and user-friendly charts can be created in Bento, a free data visualization tool. To learn more about Bento, go to www.getbento.info/about or email bento@mgt.us.
In spring 2024 and spring 2025, we asked nationally representative samples of K–12 public school districts to estimate what percentage of their students had missed 10 percent or more of school days (i.e., had been chronically absent) during the school year. We used districts’ responses to this survey item to construct a national estimate of the chronic absenteeism rate in the 2023–2024 and 2024–2025 school years, as shown in Figure 1.[2]
As reported in Diliberti et al. (2014), we estimate that roughly 19 percent of K–12 students nationally (or about 9.4 million students) were chronically absent in the 2023–2024 school year. Our updated estimate for the 2024–2025 school year is roughly 22 percent (10.8 million students). Because these estimates are derived from district leaders’ best recollections of their student absenteeism rates, they are subject to some degree of uncertainty, as represented by the confidence intervals in Figure 1.[3]
In Figure 1, we present these survey-based national estimates alongside annual chronic absenteeism rates for the school years 2016–2017 through 2023–2024 that we obtained from Malkus (2025).[4] Although the Malkus estimates were constructed using a different methodology than our estimates, we include them to provide the best available context to interpret our 2024–2025 estimate. Nevertheless, readers should use caution when interpreting the trendline because our estimate is both derived through a different method and imprecise because of our data limitations.[5]
With these caveats in mind, our 2024–2025 estimate is lower than the estimated 28 percent of students who were chronically absent in the 2021–2022 school year but notably is still above the prepandemic rate of about 15 percent.
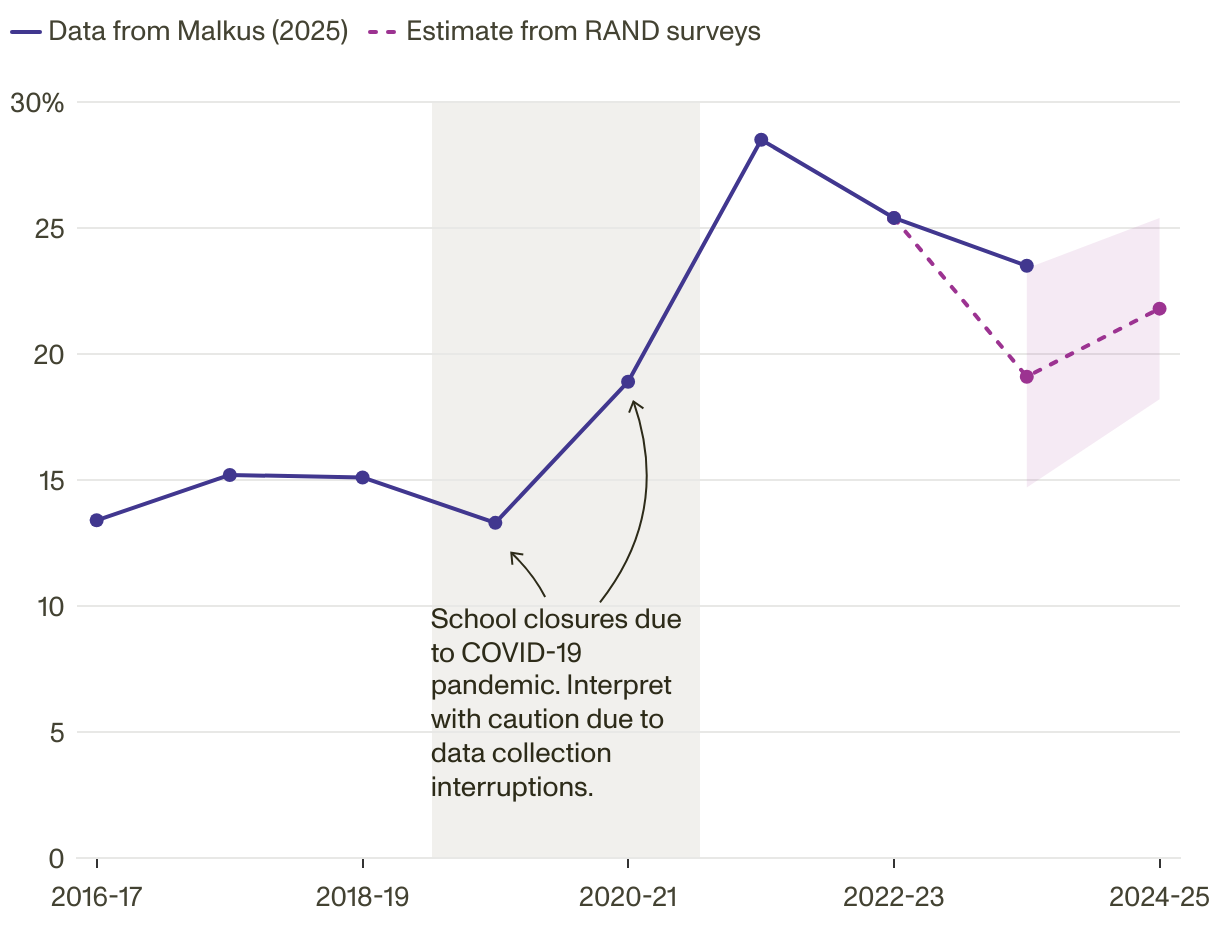
This line chart displays chronic absenteeism rates by school year from 2016–17 through 2024–25.
Key data points:
A shaded region highlights the 2019–20 and 2020–21 school years, with a note indicating school closures due to the COVID-19 pandemic and a caution to interpret data from this period carefully due to data collection interruptions.
NOTE: Data for school years 2016–2017 through 2023–2024 were obtained from Malkus (2025). Data from 2023–2024 and 2024–2025 were obtained from our nationally representative surveys of districts. The y-axis shows percentage of students who were absent, and the x-axis shows the school year.
Data collection was particularly unreliable during the 2019–2020 and 2020–2021 school years because of the transition to remote instruction that occurred during the height of the COVID-19 pandemic. Some districts stopped reporting attendance data and those that did report such data likely used differing definitions of attendance (Schwartz et al., 2021).
When we interviewed district leaders, their comments mirrored these findings. Even as their districts’ attendance rates improved, 11 of the 14 leaders reported that their districts’ chronic absenteeism rates are still “too high” or “disappointing.” As one leader from a district with more than 20 percent of students chronically absent said, “That number has actually dropped each year since we came back from COVID full-time . . . even though it still feels very high.” All of the district leaders with whom we spoke said that they are “continuing to work on” reducing absenteeism.
We categorized the severity of districts’ chronic absenteeism levels using definitions from Attendance Works (2024): low (0 to 5 percent of students chronically absent), modest (5 percent to 10 percent of students chronically absent), significant (10 percent to 20 percent of students chronically absent), high (20 to 30 percent of students chronically absent), and extreme (30 percent or more of students chronically absent). Figure 2 shows the distribution of our surveyed districts across these severity levels in the 2024–2025 school year. As shown in purple, about one in ten of our surveyed districts reported extreme chronic absenteeism levels in 2024–2025. Meanwhile, fewer than one in ten districts had low absenteeism levels, as shown in yellow. Most districts fell in the middle of the spectrum. That is, about two or three districts in ten had modest, significant, and high rates of absenteeism in the 2024–2025 school year.

| District Subgroup | Low (%) | Modest (%) | Significant (%) | High (%) | Extreme (%) |
|---|---|---|---|---|---|
| Total | 7 | 24 | 30 | 28 | 11 |
| Urban | 0* | 0* | 23 | 33 | 44* |
| Suburban | 8 | 42* | 27 | 16 | 7 |
| Rural | 8 | 19 | 32 | 31 | 9 |
| Low poverty | 11 | 46* | 28 | 15* | 1* |
| Middle poverty | 5 | 19 | 36 | 28 | 12 |
| High poverty | 8 | 10* | 21 | 41 | 20 |
| Majority White students | 10* | 25 | 33 | 23 | 8 |
| Majority students of color | 1 | 19 | 24 | 38 | 18 |
An annotation that encompasses the "Extreme" category of Urban, Surburban, and Rural indicates: "Urban districts were five to six times more likely to report extreme chronic absenteeism than their rural and suburban peers."
NOTE: This figure depicts response data from the following survey question: “What percentage of your students have missed 10 percent or more of school days (i.e., have been chronically absent) thus far during the 2024–2025 school year?” (n = 202). We categorized districts by the severity of their chronic absenteeism levels using definitions from Attendance Works (2024). An asterisk (*) indicates that the subgroup percentage of districts reporting a specific chronic absenteeism severity level is statistically significantly different (p < 0.05) from the remainder of districts not in that subgroup that said the same. The purple box is intended to call attention to the much higher rate of extreme chronic absenteeism reported by urban districts compared with suburban and rural districts.
However, the severity of chronic absenteeism levels varied significantly across different types of districts as shown in Figure 2. Most concerningly, nearly half of urban districts reported extreme levels of chronic absenteeism, meaning that 30 percent or more of students in urban districts were chronically absent. Urban districts were roughly five to six times more likely to report extreme chronic absenteeism levels than their rural and suburban peers did (see the purple box in Figure 2). This finding suggests that dangerously high levels of chronic absenteeism is a problem that is largely concentrated in urban districts.[6] Of course, high levels of chronic absenteeism is not an entirely new problem for urban districts; even before the COVID-19 pandemic began, urban districts had higher absenteeism rates than their suburban and rural peers (Malkus, 2025).
We talked to two leaders in urban districts with extreme chronic absenteeism levels about why they thought their rates remained elevated. Their responses generally matched those of the district leaders in suburban and rural areas. They cited an increase in student and family disengagement, student illnesses and mental health challenges, and transportation issues, but they emphasized that the challenges they face in urban districts “are just that much more acute and concentrated.”
We asked about 1,300 youths, ages 12 to 21, who are enrolled in K–12 schools and are part of the RAND American Youth Panel, created in 2024, whether they thought it was a problem when children miss three or more weeks of school in a single school year. Most of the students (74 percent) said that missing three weeks of school is mostly a problem and that it is hard to catch up from that much missed school. However, one-quarter of youths (26 percent) said that missing three weeks of school is “mostly OK” and that students can make up what they missed online or in person (see Figure 3).
Youths’ perceptions about whether being chronically absent is a problem did not depend on gender, race/ethnicity, or age group. However, we did find one factor associated with youths’ beliefs about whether being absent is problematic: their parents’ highest education level. More specifically, youths whose parents’ highest education levels were high school completion (or less) were more likely than youths whose parents had higher education levels to say that they believe missing three weeks of school is mostly OK (see Figure 3). A full one-third of students whose parents did not complete further education after high school said that they felt missing three weeks of school is mostly OK.

| Group | Percentage |
|---|---|
| All youth | 26% |
| Parents’ highest education: High school or less (reference group) | 33% |
| Parents’ highest education: Some college or associate’s degree* | 24% |
| Parents’ highest education: Bachelor’s degree or higher* | 23% |
NOTE: This figure depicts response data from the following survey question administered to a nationally representative sample of youths ages 12 to 21: “Is it OK or is it a problem when kids miss three or more weeks of school in a school year?” (n = 1,337). Youths were asked to choose between two response options: (1) “It’s mostly OK. Kids can make up what they missed online or in person” or (2) “It’s mostly a problem. It’s hard to catch up from that much missed school.” Only youths who were enrolled in K–12 schools at the time of survey administration received this question. The y-axis shows the percentage of youths. An asterisk (*) indicates that the subgroup percentage of youths reporting that it is “mostly OK” to miss three weeks of school is statistically significantly different (p < 0.05) from the percentage of youths with a parent whose highest level of education was high school (or less) and who said the same.
All told, 82 percent of youths reported that they had missed at least some school in 2024–2025. Perhaps related to their beliefs about whether missing school is problematic, children of parents whose highest education level was high school completion (or less) were slightly more likely than youths whose parents completed higher levels of education to say that they had missed at least some school this year.
We asked youths to identify all the reasons why they had missed school in the 2024–2025 school year. By far, the most common reason that youths identified was sickness: 67 percent of them said that they had missed because of sickness (see Figure 4). Other reasons that youths identified for missing school were not nearly as prevalent: 10 percent said that they missed school because they felt down or anxious, 9 percent said that they missed school because they overslept, and 7 percent said that they missed school because they were uninterested. Though still not very prevalent, older youths (those 15 to 17 years old) were more likely than younger youths (those 12 to 14 years old) to identify these three things (anxiety, oversleeping, and disinterest) as reasons for having missed school. Meanwhile, less than 5 percent of youths selected the other reasons noted, including needing to care for a family member (4 percent), lack of transportation to school (3 percent), being too far behind on schoolwork (3 percent), and work conflicts (1 percent).

| Reason for missing school | Percentage of youths |
|---|---|
| Sickness | 67% |
| Felt down or anxious | 10% |
| Oversleeping | 9% |
| Uninterested in school | 7% |
| Needed to care for a family member | 4% |
| Lack of transportation to school | 3% |
| Too behind on schoolwork to go | 3% |
| Work hours conflict with school hours | 1% |
NOTE: This figure depicts response data from the following survey question administered to a nationally representative sample of youths ages 12 to 21: “What are all the reasons you have missed school this year?” (n = 1,342). Only youths who were enrolled in K–12 schools at the time of survey administration received this question. Respondents were instructed to select all that apply. Eighteen percent of youths selected, “I haven’t missed any school this year.”
Taken altogether, these findings support the hypothesis that one reason absenteeism has remained above prepandemic levels is simply because youths and their families are taking sicknesses more seriously after the pandemic. What we heard from district leaders further supports this hypothesis. In interviews, some district leaders said that they believed schools and families had overcorrected when it came to dealing with children’s sicknesses by encouraging children to stay home for even mild symptoms. As one leader from a rural district expressed, “I think we had trained them during COVID.”
However, it may also be the case that youths report sickness as their reason for missing school because this reason might be more socially acceptable than others. Youths also might interpret sickness as encompassing other health and wellness reasons for missing school (e.g., “taking a mental health day”); therefore, youths’ responses may overrepresent sickness as the primary reason for school absences.
In interviews, six out of 14 district leaders described addressing chronic absenteeism as a high priority in their districts. Given the high rates of chronic absenteeism, most district leaders reported using multiple strategies to address the challenge from different angles.[7] As one leader from a suburban district explained: “I don’t think it’s a one-size-fits-all kind of thing for this. . . . It’s finding the right combination to put in place.” In total, 12 out of 14 district leaders with whom we spoke described combining efforts across the three strategies described below.
District leaders also suggested that addressing the full scope of chronic absenteeism remains difficult given limited capacity and external barriers. In a departure from similar interviews that we conducted with district leaders in spring 2024 (Diliberti et al., 2024), five leaders suggested in spring 2025 that their absenteeism levels are being driven by out-of-school factors that are often beyond the district’s control. For example, four leaders described how housing and transportation instabilities have created persistent difficulties connecting with families, particularly when contact information changes frequently or families remain disengaged despite school-provided support services. Other leaders pointed to broader, systemic issues, such as mental health needs and food insecurity that may affect families’ ability to ensure that their children are in school, all of which districts cannot solve alone.
Districts’ ongoing—and, in many cases, expanded—efforts to reduce chronic absenteeism remains challenging with fewer resources. In interviews, four leaders cited inadequate funding and staffing following the end of federal pandemic relief funding as a challenge. One district leader explained that they could not scale their promising, relationship-based strategies, such as home visits, without enough personnel. Three leaders expressed that their staff were experiencing fatigue addressing chronic absenteeism, saying it can be disheartening when repeated efforts fail to improve attendance or reengage families. Although some formal consequences exist (e.g., truancy court, required parent meetings), leaders noted that these measures are often difficult to enforce or lack impact, leaving staff feeling like there is little follow-through when other strategies do not work. As one leader explained, “There’s a lot of fatigue around chronic absenteeism. . . . It’s a lot of work. It’s a lot of paperwork. It’s a lot of paper-pushing. It’s a lot of phone calls . . . and [staff] don’t see an immediate effect.”
Data from our spring 2025 survey of K–12 public school districts and follow-up interviews with district leaders confirm that heightened chronic absenteeism levels have persisted years after the end of the COVID-19 pandemic. Importantly, this problem remains highly concentrated in urban districts, about half of which are experiencing extreme levels of chronic absenteeism (defined as 30 percent or more of students chronically absent).
In interviews, district leaders reported trying to combat chronic absenteeism with multipronged strategies, including focusing on family messaging and tailoring interventions by age group. Given the magnitude and persistence of the problem, districts’ choice to use multiple approaches likely makes sense because no single approach is likely to make a significant dent in the problem.
Although districts’ current approaches might be helping at least some students return to school, clearly there is room for continued improvement. Going forward, districts need help identifying what does and does not work for their specific student populations. Districts need to more rigorously test their interventions (e.g., more career-relevant high school programming, tailored messages) to determine which efforts are most effective in differing district contexts and how different interventions can be used in concert. Some districts, such as Baltimore City Public Schools, have taken this on themselves (Baltimore City Public Schools, 2023). Baltimore has devoted a central office department to tracking the effectiveness of various school-level interventions and working to scale up those that prove most effective (Hill et al., 2024). The district has also enlisted many individuals, from students up to the mayor, in communicating the importance of daily attendance (Mayor’s Office, City of Baltimore, 2023).
Youths said that they are most commonly missing school for a legitimate reason: sickness. But it is also possible that parents are keeping children home for minor illnesses when they should be sending them to school. Schools and districts likely need to reopen conversations with parents about the benefits of in-person schooling. In particular, districts may need to talk directly with parents—especially parents of younger students—about how sick is “sick enough” to keep their children home and when it is appropriate to send them to school, even if the child is not feeling perfectly well.
Parents are not the only ones making decisions about whether their children should stay home from school: Older youths likely have input into their attendance. Importantly, these youths are the ones most likely to be staying home for nonsickness-related reasons. Therefore, districts may also need to reengage directly with their students (especially their older students) about the importance of in-person schooling because these youths may not be convinced. An alarming number of youths reported in our survey that missing three weeks of school is “mostly OK.” Presumably, this is because youths feel disinterested in what they are missing in the classroom or because they feel that they can easily keep up from home. Research on the contemporary uses of asynchronous learning has yet to shed light on whether this is true, and older research on the effect of absences indicates that it is not.
The bottom line is that chronic absenteeism is a glaring problem—especially for urban districts. It is likely that many, if not most, students who are not physically present fall behind, especially as they miss increasingly more days of school.
We are extremely grateful to the educators and students who agreed to participate in the ASDP and American Youth Panel, respectively. Their time and willingness to share their experiences were invaluable to this effort and helping us understand how to better support work in schools. We thank Daniel Ibarrola, Aida Escobar, and Sarah Ohls for helping manage the surveys; Gerald Hunter and Julie Newell for serving as the data managers for these surveys; and Tim Colvin and Roberto Guevara for programming these surveys. Thanks to Claude Messan Setodji and Joshua Eagan for managing the sampling and weighting for these analyses. Thanks also to AK Keskin, who assisted with some of the survey analyses. We greatly appreciate the administrative support provided by Tina Petrossian. We also appreciate feedback from Elaine Wang in reviewing this report. We thank Sy Doan and Liz Cohen for helpful feedback that greatly improved this short report. We also thank Maria Vega for her editorial expertise and Monette Velasco for overseeing the publication process.
This report is based on research funded by the Gates Foundation and undertaken by RAND Education and Labor.
This work is licensed under a Creative Commons Attribution 4.0 International License. All users of the publication are permitted to copy and redistribute the material in any medium or format and transform and build upon the material, including for any purpose (including commercial) without further permission or fees being required.
This publication is part of the RAND research report series. Research reports present research findings and objective analysis that address the challenges facing the public and private sectors. All RAND research reports undergo rigorous peer review to ensure high standards for research quality and objectivity.
This work is licensed under a Creative Commons Attribution 4.0 International License. All users of the publication are permitted to copy and redistribute the material in any medium or format and transform and build upon the material, including for any purpose (including commercial) without further permission or fees being required.
RAND is a nonprofit institution that helps improve policy and decisionmaking through research and analysis. RAND's publications do not necessarily reflect the opinions of its research clients and sponsors.


