
Press
Millions of U.S. Adults Microdosing Psychedelics
Jan 21, 2026
Insights from a Probability-Based and Nationally Representative Survey
ResearchPublished Jan 21, 2026

Photo by Cannabis-Pic/Getty Images
This is the first report from the 2025 RAND Psychedelics Survey, which was fielded in September 2025 to a probability-based, nationally representative sample[1] of 10,122 adults ages 18 years and older living in the United States at that time. This report presents top-line results on the use of 11 psychedelic substances and detailed information about microdosing (i.e., taking a small fraction of a full dose, often intermittently on a schedule) for psilocybin, LSD, and MDMA. These results should be of interest to those contemplating changes to psychedelics policies, researchers interested in use patterns (especially for microdosing), and others interested in learning more about these substances.
Psychedelic substances[2]—such as psilocybin mushrooms, MDMA, LSD, and ibogaine—have long been touted as holding promise for treating various mental health conditions. Although medical research into the potential benefits and risks of psychedelic substances has increased, there is still a lot to learn about the use of these substances outside clinical settings. There is some evidence that the use of some of these substances, especially psilocybin mushrooms, is increasing in the United States (Rockhill et al., 2025). Although the supply and possession of many psychedelic substances are federally prohibited in the United States—with some exceptions (see Kilmer et al., 2024)—increasing numbers of U.S. states and localities have changed or are considering changing their policies on some psychedelic substances (Andrews et al., 2025). Additional data on the use of these substances in the United States are needed to inform policy debates.
Dosing practices are an area of particular unknowns with potential health implications. Psychedelic substances are sometimes taken in microdoses. Microdosing is defined as taking a small fraction of a full dose, often on a schedule over multiple days or weeks (Marks et al., 2023). Although there is no official standard for what constitutes a microdose, a commonly used measure is 10 percent or less of the regular dose one would take to feel the full perception-altering effects of the substance (Szigeti et al., 2021). A nationally representative survey fielded in 2023 found that about 47 percent of those who used psilocybin mushrooms in the past year reported microdosing the last time they used the substance (Kilmer et al., 2024).[3] Those who microdose report doing so for many reasons, ranging from managing anxiety and depression symptoms to improving mood and creativity (Nutt, 2024; Lea et al., 2020). A few clinical trials have focused on microdosing (e.g., Petranker et al., 2024; Murphy, Muthukumaraswamy, and de Wit, 2024; Mueller et al., 2025), and one review of the microdosing literature has called for more research on implications for cardiac fibrosis and valvulopathy (Rouaud, Calder, and Hasler, 2024).
Some other national surveys ask respondents about their use of psychedelic substances, but each has limitations. Additionally, the consumption of psychedelics by U.S. adults is rapidly changing, creating a need for the most-current data as possible. The National Survey on Drug Use and Health (NSDUH), which recently released top-line results for 2024, is the main source of nationally representative data on substance use and includes some questions about recent use of some psychedelics (e.g., past-year use of psilocybin was added in 2024) (Substance Abuse and Mental Health Services Administration, 2025). However, the NSDUH does not cover all substances that are part of current policy discussions—for example, specific questions about the use of ibogaine are not included in NSDUH. Another source, the National Survey Investigating Hallucinogenic Trends (NSIHT), also collects data about past-year use of psychedelics from a nationally representative sample, but neither the NSDUH nor NSIHT has reported data about microdosing psychedelics (Rocky Mountain Poison and Drug Safety, 2025).
This report contributes to existing nationally representative data sources with population-weighted estimates of past-year use of psychedelics by U.S. adults from data collected in September 2025. We estimate the proportion of adults in the United States who have used a variety of psychedelics in the past year, including psilocybin, MDMA, ketamine, LSD, and Amanita muscaria mushrooms.[4] Then, we present groundbreaking estimates for how many U.S. adults have microdosed psilocybin, LSD, and/or MDMA in the past year. We also show a comparison of the number of days that U.S. adults used psilocybin, LSD, and MDMA in the past year and what share of those days involved microdosing.
All estimates in this report are based on self‑reported survey data. For simplicity of presentation, we refer to these responses as use in this report, although these responses represent respondents’ self‑reports rather than confirmed use. Readers should also note that microdosing can be difficult to define and whether individuals microdosed is self-reported in these data. See Appendix A for a discussion of additional limitations, tables that show the data used to create the figures, and methodological details about the statistical analysis.
We asked respondents, “Have you ever used any of these substances in your lifetime? Select yes for any substance you’ve ever used, even if you only tried it one time or it was many years ago.” The list of substances consisted of alcohol, cannabis, and a variety of psychedelic substances. For respondents who reported that they had used any of these substances, we then followed up with questions about how recently they had last used the substance. Figure 1 shows past-year use rates, and Table 1 shows population estimates for the use of the following psychedelic substances:[5]
Psilocybin stands out with a past-year prevalence rate of 4.26 percent, approximately 11 million U.S. adults.[6] Other psychedelic substances in the top five for past-year use are MDMA/MDA (1.81 percent—approximately 4.7 million U.S. adults), Amanita muscaria mushrooms (1.34 percent—approximately 3.5 million U.S. adults), ketamine (1.26 percent—approximately 3.3 million U.S. adults), and LSD (1.15 percent—approximately 3 million U.S. adults).

SOURCE: Features information from the authors’ complete case analysis of respondents (N = 10,122) from RAND Psychedelics Survey data from September 2025 using population weights.
NOTE: Each bar shows the estimated percentage of U.S. adults who used that specific substance in the past year (past-year use prevalence) from national survey data. A detailed table of these past-year use prevalence rates and the associated 95 percent confidence interval (CI) is available as Table A.1 in Appendix A.
| Substance | Past-Year Use Population Estimate | 95% CI | ||
|---|---|---|---|---|
| Lower | Upper | |||
| Psilocybin | 11,059,000 | 9,404,000 | 12,715,000 | |
| MDMA or MDA | 4,699,000 | 3,765,000 | 5,634,000 | |
| Amanita muscaria | 3,469,000 | 2,657,000 | 4,282,000 | |
| Ketamine | 3,268,000 | 2,443,000 | 4,093,000 | |
| LSD | 2,982,000 | 2,196,000 | 3,768,000 | |
| DMT | 2,189,000 | 1,250,000 | 3,128,000 | |
| Mescaline | 1,375,000 | 833,000 | 1,916,000 | |
| 2C-B | 1,201,000 | 679,000 | 1,723,000 | |
| Salvia divinorum | 1,112,000 | 616,000 | 1,608,000 | |
| Ibogaine or iboga | 941,000 | 434,000 | 1,449,000 | |
| 5-MeO-DMT | 769,000 | 340,000 | 1,198,000 | |
SOURCE: Features information from authors’ complete case analysis of N = 10,122 respondents from RAND Psychedelics Survey data from September 2025 using population weights.
NOTE: Population estimates are weighted to represent approximately 259 million U.S. adults ages 18 years and older. Estimates rounded to the nearest thousand.
We asked respondents who reported using psilocybin,[7] LSD, or MDMA in the past year how many days in the past year they used each substance and how many of those days they microdosed. We defined microdosing in the survey questions as “taking a small fraction of a regular dose (a subperceptual dose) that is much lower than you would take to ‘trip’ or hallucinate on these substances.” Although our survey only asked questions about microdosing for psilocybin, MDMA, and LSD, there are also reports of other psychedelic substances listed in Figure 1 being microdosed—for example, ketamine and Amanita muscaria (Syed et al., 2024; Leas et al., 2024).
Figure 2 shows weighted estimates of the proportion of U.S. adults who have microdosed each substance at least one day in the past year, according to the 2025 RAND Psychedelics Survey data. Among U.S. adults who reported using each substance in the past year, we estimated that 69 percent microdosed psilocybin, 65 percent microdosed MDMA, and 59 percent microdosed LSD at least one day.

SOURCE: Features information from authors’ complete case analysis of RAND Psychedelics Survey data from September 2025 using population weights.
NOTE: These estimates were based on the following unweighted samples for the number of respondents reporting use of each substance in the past year: psilocybin, n = 372; MDMA, n = 163; LSD, n = 90. These sample sizes reflect the unweighted number of respondents reporting use of each substance in the past year, while percentages reflect survey-weighted estimates to reflect the U.S. adult population who microdosed each substance at least one day in the past year. A detailed table of these estimated proportions and a range of their uncertainty is available in Table A.2 in Appendix A. Note that these are proportions from among the weighted past-year use estimates for the U.S. adult population for each substance, which are 4.26 percent for psilocybin, 1.81 percent for MDMA, and 1.15 percent for LSD.
According to survey responses, we estimated that approximately 9.55 million U.S. adults microdosed one or more of psilocybin, MDMA, or LSD in the past year (about 3.7 percent).[8] This total reflects an overlap-adjusted estimate of unique individuals who microdosed.
Figure 3 shows weighted estimates for the share of use days U.S. adults microdosed in the past year by substance for psilocybin, MDMA, and LSD. For psilocybin, we estimated approximately 216 million use days in the past year, of which approximately 102 million involved microdosing (47 percent). For MDMA, we estimated approximately 62.5 million use days in the past year, of which approximately 26.5 million involved microdosing (42 percent). For LSD, we estimated approximately 21 million use days in the past year, of which approximately 8.6 million involved microdosing (41 percent).
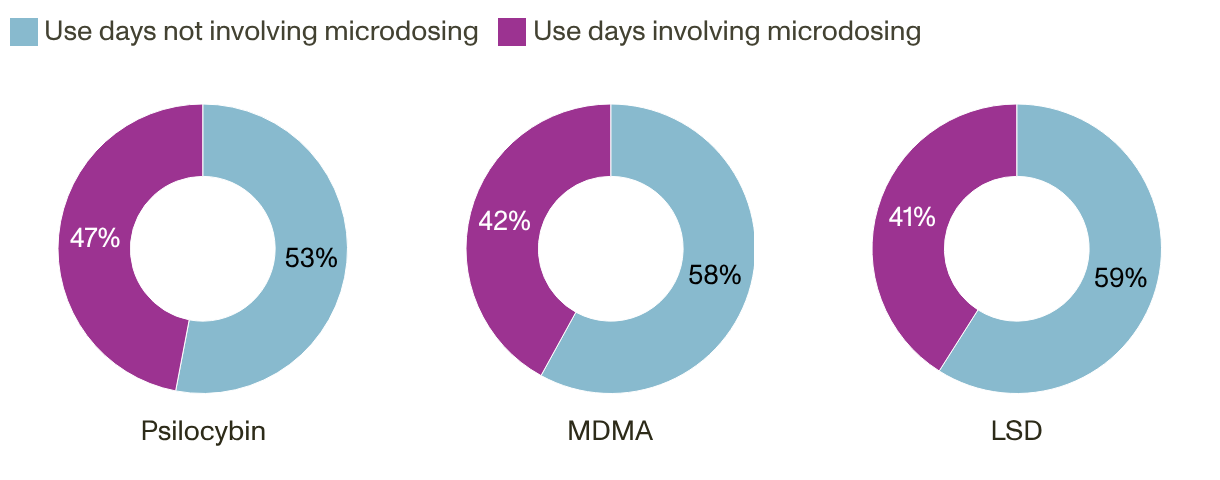
SOURCE: Features information from authors’ complete case analysis of RAND Psychedelics Survey data from September 2025 using population weights.
NOTE: These estimates were based on the following unweighted samples for the number of respondents reporting use of each substance in the past year: psilocybin, n = 372; MDMA, n = 163; LSD, n = 90. These sample sizes reflect the unweighted number of respondents reporting use for each substance in the past year, and percentages reflect survey-weighted estimates to reflect the share of microdosing days among the U.S. adult population. A detailed table of these proportions, as well as weighted population estimates for total use days and microdosing use days for each substance, is available as Table A.3 in Appendix A.
Although microdosing accounts for a noteworthy share of reported past-year use days, it accounts for a much smaller share of the total amount consumed of the substance in the past year. For example, if a typical microdose of psilocybin is 10 percent the size of a regular dose, and one assumes that very few people take a regular dose and a microdose on the same day, then less than 10 percent of the psilocybin consumed in the past year was in the form of microdosing:
Further research into amounts consumed in full doses and microdoses of these substances can aid in generating estimates for the total amount of these substances that are consumed nationwide. Future research could extend such calculations to include the total amount of spending on psychedelic substances attributable to microdoses.
All analyses were conducted by RAND researchers in R version 4.4.2 using U.S. population weights created by NORC. All results in the main text of this report, including figures and tables, were created using complete case analysis (N = 10,122) since the rate of missingness for the prevalence observations analyzed in this report is less than 4 percent. The results of a sensitivity analysis using multiple imputations are presented in Appendix B, which are very similar to the results of the complete case analyses shown here and indicate that results are not sensitive to the decision of how missing data were handled (see Tables B.1–B.3).
Responses to the 2025 RAND Psychedelics Survey were limited by the relatively non-negligible proportion of survey respondents who reported using many psychedelic substances, but then the same respondents reported that they did not remember the last time they used the substance. Although this is less than 4 percent of the total sample for each substance, when only considering those who reported using in their lifetimes, some proportions of missing values increase substantially. This was the motivation for the robustness checks that we conducted using multiple imputations. The results of these robustness checks were similar enough to the complete case analyses presented earlier in this report, which suggests that any systematic patterns of use among respondents with missing data would not change the results substantially.
Another limitation of our study is the lack of a standard definition of microdosing. In our survey questionnaire, we described microdosing as “taking a small fraction of a regular dose (a subperceptual dose) that is much lower than you would take to ‘trip’ or hallucinate on these substances.” However, this characterization is subjective and open to interpretation. What our results do reflect is the intention and perception of respondents about whether they microdosed or not given their own individual understanding of the term.
Relatedly, our survey presents self-reported data, and respondents might have misreported for a variety of reasons, including inaccuracies in memory. However, we do not have any information about the share of people who might have misreported their use of these substances.
Finally, the population estimates presented here are likely underestimates. The AmeriSpeak panel covers 97 percent of the household population. Because this value is less than 100 percent, and the panel is based on the household population, population estimates presented here are likely underestimates of the true population totals. Some populations, such as those who are unhoused and those in correctional facilities, are not included in the household sampling frame and may have different substance use patterns from our overall sample. Additionally, our estimate of those who microdosed one or more psychedelics in the past year only considers microdosing psilocybin, MDMA, or LSD. We know that some other psychedelic substances are also microdosed in the United States, such as ketamine and Amanita muscaria. So, this is a conservative estimate for the total number of adults who microdosed psychedelics in the United States in 2025.
| Substance | Past-Year Use | 95% CI | Standard Error | Population Estimate |
|---|---|---|---|---|
| Psilocybin | 0.04263 | 0.03624, 0.04901 | 0.0033 | 11,059,384 |
| MDMA or MDA | 0.01811 | 0.01451, 0.02171 | 0.0018 | 4,699,447 |
| Amanita muscaria | 0.01337 | 0.01024, 0.01650 | 0.0016 | 3,469,387 |
| Ketamine | 0.01260 | 0.00941, 0.01578 | 0.0016 | 3,267,793 |
| LSD | 0.01149 | 0.00846, 0.01452 | 0.0015 | 2,982,137 |
| DMT | 0.00844 | 0.00482, 0.01206 | 0.0018 | 2,188,941 |
| Mescaline | 0.00530 | 0.00321, 0.00739 | 0.0011 | 1,374,860 |
| 2C-B | 0.00463 | 0.00262, 0.00664 | 0.0010 | 1,201,183 |
| Salvia divinorum | 0.00429 | 0.00237, 0.00620 | 0.0010 | 1,111,828 |
| Ibogaine or iboga | 0.00363 | 0.00167, 0.00559 | 0.0010 | 941,472 |
| 5-MeO-DMT | 0.00297 | 0.00131, 0.00462 | 0.0008 | 769,352 |
SOURCE: Features information from the authors’ complete case analysis of N = 10,122 respondents from RAND Psychedelics Survey data from September 2025 using population weights.
NOTES: Estimates shown here were calculated using complete case analysis from the full survey sample of 10,122 respondents. Population estimates are weighted to represent approximately 259 million U.S. adults ages 18 years and older. More details on missing data and a sensitivity analysis can be found in Appendix B.
| Substance | Did Not Microdose,Proportion [95% CI] | Microdosed 1+ Days, Proportion [95% CI] |
|---|---|---|
| Psilocybin (n = 372) | 0.309 [0.233, 0.396] | 0.691 [0.604, 0.767] |
| MDMA (n = 163) | 0.349 [0.257, 0.454] | 0.651 [0.546, 0.743] |
| LSD (n = 90) | 0.413 [0.289, 0.549] | 0.587 [0.451, 0.711] |
SOURCE: Features information from the authors’ analysis of RAND Psychedelics Survey data from September 2025 using population weights.
NOTES: Sample totals (n) for each substance are the unweighted number of respondents reporting use of each substance in the past year, and percentages reflect survey-weighted estimates to reflect the U.S. adult population. More details on missing data and a sensitivity analysis can be found in Appendix B.
| Substance | Share of Total Use Days Involving Microdosing | Estimated Total Use Days | Estimated Microdosing Use Days |
|---|---|---|---|
| Psilocybin (n = 372) | 47.4% | 215,965,000 | 102,378,000 |
| MDMA (n = 163) | 42.4% | 62,527,000 | 26,541,000 |
| LSD (n = 90) | 40.9% | 20,952,000 | 8,573,000 |
SOURCE: Features information from the authors’ analysis of RAND Psychedelics Survey data from September 2025.
NOTES: Sample totals (n) for each substance are the unweighted number of respondents reporting use of each substance in the past year, and percentages reflect survey-weighted estimates to reflect the share of microdosing days for each substance in the U.S. adult population. More details on missing data and a sensitivity analysis can be found in Appendix B. Estimates are rounded to the nearest thousand.
We imputed missing values using the multiple imputation by chained equations (MICE) procedure in R (“mice” package). Because the rates of missingness for the prevalence observations analyzed in this report were low (less than 4 percent), we did not expect substantial changes in estimates. Nevertheless, we chose to conduct the imputations as a robustness check.
We ran ten imputation iterations and imputed all missing values for all variables in the same imputation model. We imputed values for past-year reported use of all 11 psychedelic substances reported earlier in this report, as well as total use days and total microdosing days for psilocybin mushrooms, MDMA, and LSD.
We included socioeconomic and demographic variables as controls in the imputation model, and none of these variables had missing data: age, sex, race/ethnicity, educational attainment, employment status, income, marital status, region of residence, whether respondents lived in a metropolitan area, and military veteran status. We also included responses to survey questions from the 2025 RAND Psychedelics Survey that asked about perspectives on the legalization of psilocybin mushrooms, LSD, MDMA, marijuana, and cocaine, which were missing less than 2 percent of observations.
After the imputations were completed, we implemented logical checks on the imputed data to ensure that (1) there were no use days or microdosing days for those who did not use in the past year, (2) total days of use for those who used in the past year were greater than one but fewer than 366, and (3) total microdosing days did not exceed total use days in the past year. For microdosing days imputed, the minimum between the imputed value and the total use days was used for microdosing days in our analysis.
Comparisons of the survey weighted estimates focused on complete cases, and multiple imputation are reported in Tables B.1–B.3. Estimates from the two approaches are consistent, with most of the differences between the imputed and complete case estimates generally in the hundreds or thousands place (depending on rounding). Additionally, there is a large overlap of 95 percent CIs for the complete case analyses and the imputations. The main takeaways in this report would not change if we used these imputed estimates (i.e., it would still be true that psilocybin is the most used substance and that on the order of 10 million adults microdosed psilocybin, LSD, or MDMA in 2025).
| Substance | Past-Year Use, Complete Cases | 95% CI, Complete Cases | Past-Year Use, Imputed | 95% CI, Imputed | Percentage, Missing |
|---|---|---|---|---|---|
| Psilocybin | 0.043 | 0.036, 0.049 | 0.043 | 0.037, 0.050 | 3.1 |
| MDMA or MDA | 0.018 | 0.015, 0.022 | 0.019 | 0.015, 0.024 | 2.7 |
| Amanita muscaria | 0.013 | 0.010, 0.017 | 0.014 | 0.010, 0.018 | 2.1 |
| Ketamine | 0.013 | 0.009, 0.016 | 0.013 | 0.010, 0.016 | 2.5 |
| LSD | 0.011 | 0.008, 0.015 | 0.013 | 0.009, 0.017 | 3.7 |
| DMT | 0.008 | 0.005, 0.012 | 0.009 | 0.006, 0.013 | 2.1 |
| Mescaline | 0.005 | 0.003, 0.007 | 0.006 | 0.004, 0.008 | 2.6 |
| 2C-B | 0.005 | 0.003, 0.007 | 0.005 | 0.003, 0.007 | 2.4 |
| Salvia divinorum | 0.004 | 0.002, 0.006 | 0.005 | 0.003, 0.007 | 2.3 |
| Ibogaine or iboga | 0.004 | 0.002, 0.006 | 0.004 | 0.002, 0.006 | 2.1 |
| 5-MeO-DMT | 0.003 | 0.001, 0.005 | 0.003 | 0.001, 0.005 | 2.2 |
| Substance | Microdosed, Complete Cases | 95% CI, Complete Cases | Microdosed, Imputed | 95% CI, Imputed | Percentage, Missing |
|---|---|---|---|---|---|
| Psilocybin | 0.691 | 0.604, 0.767 | 0.698 | 0.621, 0.775 | 3.4 |
| MDMA or MDA | 0.651 | 0.546, 0.743 | 0.671 | 0.576, 0.766 | 2.8 |
| LSD | 0.587 | 0.451, 0.711 | 0.622 | 0.496, 0.747 | 3.8 |
| Substance | Share of Total Use Days Involving Microdosing | Percentage, Missing | ||
|---|---|---|---|---|
| Complete Cases | Imputed | Total Use Days | Microdose Days | |
| Psilocybin | 47.4% | 48.1% | 3.3% | 3.4% |
| MDMA or MDA | 42.4% | 47.2% | 2.8% | 2.8% |
| LSD | 40.9% | 43.9% | 3.8% | 3.8% |
We also conducted a robustness check for the proportion of U.S. adults estimated to have microdosed one or more of psilocybin mushrooms, MDMA, or LSD in the past year. This is a weighted estimate adjusting for overlap for those who microdosed more than one of these substances. When rounded to the nearest thousandth, these are
Imputing the missing values in one model generates slightly higher point estimates than the case complete estimates, but the differences were small (typically in the hundreds or thousands place depending on rounding). We conducted manual investigations of the imputed values to ensure that the imputation was functioning as intended. Moderate positive correlation with all the past-year use estimates (0.30–0.49) could explain the minor upward shift observed in jointly imputed estimates. We also compared alternative imputation approaches (e.g., ignoring the dependencies or imputing variables separately) and found that these produce very similar estimates. This indicates that results are robust to the imputation approach and overall study findings are unaffected.
We would like to thank Rajeev Ramchand for his assistance designing and fielding the 2025 RAND Psychedelics Survey. We are grateful for the feedback provided by the following reviewers that improved this report: Kirsten Becker, director of the RAND Survey Research Group; Helin Hernandez, associate statistician at RAND; and Stephanie Lake, an epidemiologist and psychedelics researcher. We would also like to express our gratitude for the AmeriSpeak panelists who completed the 2025 RAND Psychedelics Survey and those we consulted when developing the survey questionnaire: Samer Atshan, Myfanwy Graham, Allison Hoots, Joshua Hunt, Bob Jesse, Rob MacCoun, Bryce Pardo, Samantha Perez Davila, Rosanna Smart, Andrea Venezia, and Cameron Wolf.
This work was supported by DAFgiving360 and conducted in RAND Education, Employment, and Infrastructure.
This publication is part of the RAND research report series. Research reports present research findings and objective analysis that address the challenges facing the public and private sectors. All RAND research reports undergo rigorous peer review to ensure high standards for research quality and objectivity.
This document and trademark(s) contained herein are protected by law. This representation of RAND intellectual property is provided for noncommercial use only. Unauthorized posting of this publication online is prohibited; linking directly to this product page is encouraged. Permission is required from RAND to reproduce, or reuse in another form, any of its research documents for commercial purposes. For information on reprint and reuse permissions, please visit www.rand.org/pubs/permissions.
RAND is a nonprofit institution that helps improve policy and decisionmaking through research and analysis. RAND's publications do not necessarily reflect the opinions of its research clients and sponsors.


