Implications of the Trump Retirement Accounts Proposal
Potential Costs and Savings of an Alternative Retirement Plan for 63 Million Americans
Research SummaryPublished Mar 12, 2026
Potential Costs and Savings of an Alternative Retirement Plan for 63 Million Americans
Research SummaryPublished Mar 12, 2026
RAND's modeling of the Trump retirement accounts (TRA) found that the program would be deficit neutral. It would pay for itself by reducing entitlement spending over 23 to 31 years, if TRA assets count toward eligibility. Contributions from a worker with a $50,000 salary would grow nearly fivefold over a 40-year period, assuming an 8 percent market return.
| Parameter | Finding |
|---|---|
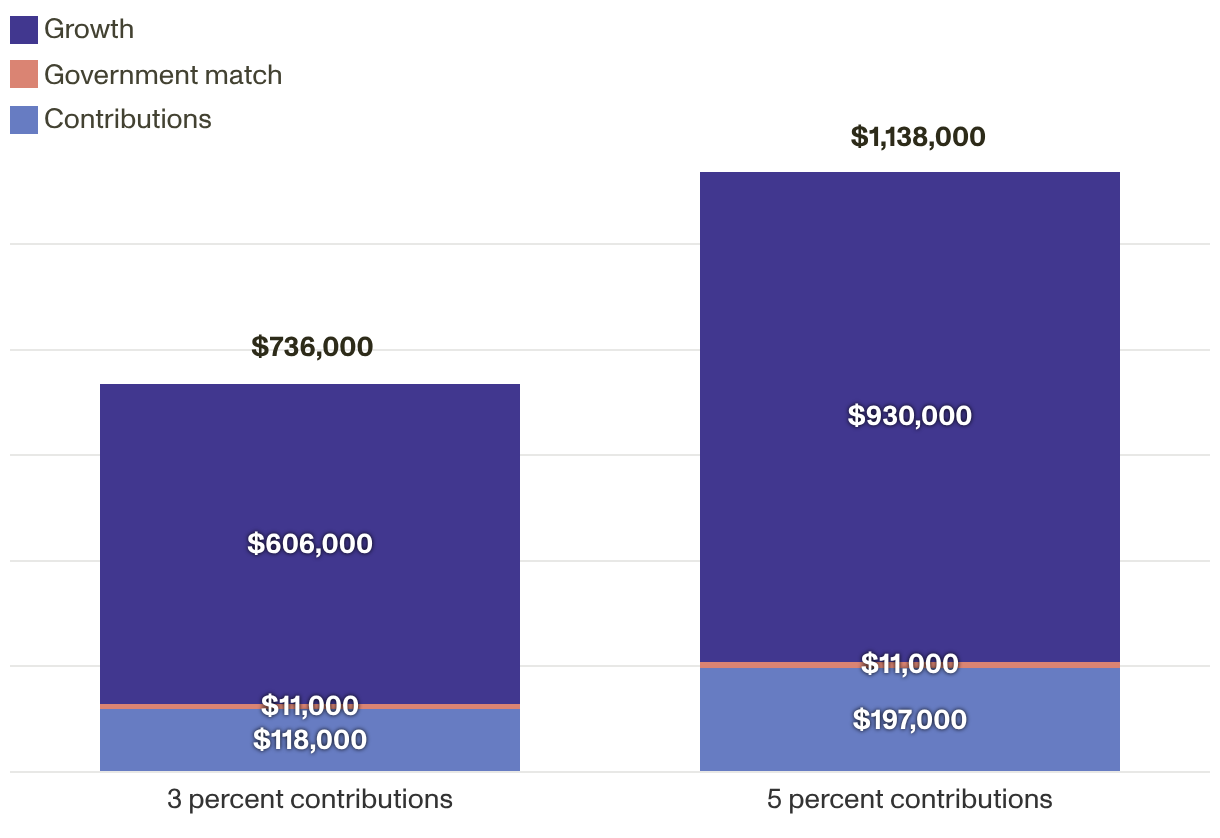
| Individual impact | A 27-year-old worker earning $50,000 per year today would retire with more than $1.1 million after 40 years, assuming contributions of 5 percent of income and 8 percent annual returns |
| Leverage | $1 in government spending would result in $103 through individual contributions and compound growth over 40 years with 8 percent annual returns |
| Entitlement savings (Assuming contributions of 3 percent and 8 percent annual returns and that TRA assets count toward eligibility) | |
| Medicaid | TRA would reduce federal Medicaid spending by $2.163 trillion |
| Supplemental Security Income (SSI) | TRA would reduce SSI spending by $162 billion |
The peak of baby boomer retirement eligibility has hit, with an estimated 300,000 Americans turning 65 years old every month. Yet 20 to 25 percent of workers have no retirement savings, and nearly 50 percent of the American workforce — about 63 million people — have no access to an employer-sponsored retirement plan. Meanwhile, the number of people over 65 who are living in poverty continues to increase, and federal and state-based safety net programs can offer only so much relief.
Policymakers have been looking for alternative programs to help workers without access to retirement plans save for their nonworking futures. One program proposed in 2025, the Retirement Savings for Americans Act (RSAA), would have granted such workers access to accounts that provide federal matching on a sliding scale. More recently, President Donald Trump introduced a similar model, the Trump retirement accounts (TRA), in his State of the Union address on February 24, 2026.
Drawing on comments made in that address, this brief presents a one-, ten-, and 40-year cost analysis of the TRA and offers insights into its policy implications. Because further details about the TRA were not immediately available, RAND researchers conducted this analysis using assumptions and modeling from a prior RAND von Furstenberg Family Budget Model Initiative study on the RSAA. A brief description of the methods and data used follows the findings and policy implications.
Assuming full participation among eligible workers and that those who are eligible contribute enough to receive the maximum $1,000 federal match,[1] RAND researchers project that the TRA would cost the U.S. government (USG) $285 billion over the first ten years. Alternatively, if all eligible workers participate but contribute only 3 percent of their income — resulting in a federal match below the $1,000 maximum — USG costs would be lower: $246 billion over ten years. By year 31, both the 3 and the 5 percent contribution rates would generate sufficient Medicaid and Supplemental Security Income (SSI) program savings to offset the costs of the TRA to both states and the federal government. By year 40, the assets held across all individual accounts in the TRA program could total about 12 percent of the amount held in all 401(k) retirement accounts (assuming full participation at the 3 percent contribution rate) or 20 percent of 401(k) assets (assuming full participation at the 5 percent contribution rate).
Tables 1 and 2 present estimates assuming that workers and the USG contribute either 3 or 5 percent of a worker's income to the TRA. The savings presented in Tables 1 and 2 come from reduced spending on Medicaid for the dual-eligible Medicaid and Medicare population of seniors and reduced spending on SSI. The savings from Medicaid include both the federal savings and the savings to state governments. Table 3 provides estimates of individual account balances for workers with different earnings levels, individual and government contribution rates, and market rates of return.
| Scenario | Individual Contribution and USG Match Rate | |
|---|---|---|
| 3% | 5% | |
| 1 year | ||
| Costs to the USG | 24 | 28 |
| Savings to the USG | 0 | 0 |
| Net costs to the USG | 24 | 28 |
| 10 years | ||
| Costs to the USG | 246 | 285 |
| Savings to the USG | 14 | 32 |
| Net costs to the USG | 232 | 253 |
| 40 years | ||
| Costs to the USG | 1,016 | 1,158 |
| Savings to the USG | 3,341 | 5,532 |
| Net costs to the USG | (2,325) | (4,374) |
NOTE: All amounts are in nominal 2025 dollars (cumulative costs are undiscounted). Costs include the interest associated with cumulative costs. An 8 percent nominal rate of return is assumed.
| Individual Contribution and USG Match Rate | ||||||
|---|---|---|---|---|---|---|
| 3% | 5% | |||||
| Market rate of return | 6% | 8% | 10% | 6% | 8% | 10% |
| Total TRA accumulated savings (billions) | 1,396 | 2,325 | 3,676 | 2,876 | 4,374 | 6,571 |
| Medicaid savings to the USG | 1,299 | 2,163 | 3,420 | 2,676 | 4,070 | 6,114 |
| SSI savings to the USG | 97 | 162 | 256 | 200 | 304 | 457 |
| Years until deficit neutrality | 31 | 28 | 26 | 27 | 26 | 23 |
NOTE: All amounts are in nominal 2025 dollars (cumulative costs are undiscounted).
If TRA assets are considered in Medicaid and SSI eligibility determinations for individuals age 65 and older, then RAND researchers estimate that the TRA could result in annual net savings in less than 20 years and cumulative net savings to the USG within 23 to 31 years. If these assets are excluded from program eligibility calculations, then there would be no federal or state savings, and the costs would be as shown in Table 1.
TRA federal contributions are capped at $1,000 per person. Individuals making $20,000 would need to contribute 5 percent of their income to the TRA to hit the federal contribution cap. However, most lower-income participants earn and contribute much less than is needed to reach this federal contribution cap ($20,000 at a 5 percent contribution rate or $33,333 at 3 percent). This results in most of the federal TRA matching contributions flowing to middle-income workers rather than the lowest-income workers.
However, if wage growth is faster than general inflation, the primary beneficiaries will be lower-income individuals as time passes because the phaseout brackets will grow at a slower rate than general wage growth.
Lower-income participants disproportionately use safety net programs, such as Medicaid and SSI. If the design of the TRA were revised to provide early USG investments for the lowest-income workers, their later reliance on Medicaid and SSI could be substantially reduced. The USG costs would be higher in the short term, but the longer-term cost savings to the USG could be greater by reducing dependence on Medicaid and SSI later in life.
The TRA would require firms to auto-enroll eligible employees with a 3 percent contribution rate. Evidence presented in a November 2024 paper by Thomas Willingham, from the U.S. Congress Joint Committee on Taxation, describes recent state-level introductions of auto-enrollment IRA programs that do not include government matches, showing savings increases far in excess of withdrawals. The TRA includes a match, which would likely further raise participation rates. The TRA also includes penalties for noncomplying firms. The effects of these penalties were not able to be assessed given the model and available data.
Evidence suggests that the introduction of a federal retirement benefit program may prompt some employers to discontinue their existing employer-sponsored plans — a phenomenon known as crowding out. However, the assumption is that because the TRA offers matching funds up to $1,000 and most employers currently offer much higher matching rates, firms with substantial employer-sponsored plans will be unlikely to switch. Firms offering minimal or no matching contributions may opt for the TRA, but, drawing on prior RSAA and TRA analyses, crowding out is expected to apply to only a small subset of employers.
Researchers employed a Monte Carlo simulation to estimate TRA costs and asset accruals under full participation, incorporating a range of plausible unemployment rates informed by a literature review and original data collection. Similar to the RSAA analysis, this model stratifies workers by earnings decile, assumes wage growth based on empirical growth by earnings decile, and incorporates unemployment spells and durations using data from the Current Population Survey.
The analysis covers a 40-year working lifetime, using an overlapping-generations approach: Younger cohorts participate in the TRA for the full period when not unemployed, whereas older cohorts participate for shorter durations. Investment returns are calculated nonstochastically with 6, 8, and 10 percent constant rates of return. Results are presented for the 10th percentile and median outcomes from 1,000 simulated individual histories for those who have participated in the program for 40 years (however, because of unemployment spells, some workers might not have contributed every year). Also note that not every participant will be in the TRA for 40 years. Owing to the nature of the overlapping-generations approach, some participants will start at age 45, for example, and participate for only 20 years. The population includes 63 million eligible participants, 42 million of whom are eligible for USG matching contributions.
Key assumptions include the following: (1) Some beneficiaries participate over a full working lifetime, and others participate for shorter periods, either because they exited the labor force for retirement or entered it the intervening years; (2) the forecast duration is 40 years; (3) there is universal participation among eligible workers; and (4) savings amounts, tax brackets, and contribution limits are indexed to inflation (using the consumer price index), and wages grow at 3 percent. Relaxing these assumptions would reduce program costs by limiting coverage and government contributions. Contribution limits and earnings eligibility are assumed to match Roth IRA rules. The assumption is that all savings are new savings, as plan participants had no employer-sponsored plan as a condition of eligibility.
Researchers analyzed two contribution scenarios:
The findings presented in this brief assume full plan participation and inflation indexing for government matches, tax brackets, and Roth IRA caps. The analyses have assumed no leakages or other withdrawals and no crowd-out (employers do not drop current retirement plans, and all savings are new and not just redirected to other after-tax savings).
In particular, the cost offsets are solely due to TRA account balances being used in the asset tests for Medicaid and SSI, thereby delaying eligibility for each. Much like RAND's prior RSAA analysis, if beneficiaries liquidate their TRA assets quickly, the delay in Medicaid and SSI eligibility will be short, and TRA program costs could exceed benefits.
This model also does not reflect changes to Medicaid under the One Big Beautiful Bill Act (OBBBA) because the over-65 Medicaid population is not affected by OBBBA's Medicaid work requirements. Some fraction of early retirees (i.e., those ages 59.5 to 64) may be subject to Medicaid work requirements or recertifications under OBBBA. Additionally, there may be other provisions in OBBBA, such as new restrictions on provider taxes, that could reduce federal spending on Medicaid, meaning that the savings associated with reduced eligibility for Medicaid among TRA participants could be lower.

This publication is part of the RAND research brief series. Research briefs present policy-oriented summaries of individual published, peer-reviewed documents or of a body of published work.
This document and trademark(s) contained herein are protected by law. This representation of RAND intellectual property is provided for noncommercial use only. Unauthorized posting of this publication online is prohibited; linking directly to this product page is encouraged. Permission is required from RAND to reproduce, or reuse in another form, any of its research documents for commercial purposes. For information on reprint and reuse permissions, please visit www.rand.org/pubs/permissions.
RAND is a nonprofit institution that helps improve policy and decisionmaking through research and analysis. RAND's publications do not necessarily reflect the opinions of its research clients and sponsors.

