The Experiences of Online Entrepreneurs in the United States
Navigating the Digital Frontier
Research SummaryPublished Jul 31, 2024
Navigating the Digital Frontier
Research SummaryPublished Jul 31, 2024
Since the coronavirus disease 2019 pandemic, rates of business creation in the United States have increased dramatically, evidenced by a surge of new business applications that has persisted into 2024 (see Figure 1). There has been more business creation activity in the past four years than at any point in the previous decade. A key contributor to this trend has been the proliferation of new online retail businesses and business owners.[1] However, although the pandemic may have spurred new online entrepreneurial activity, the trend of increased business creation activity has continued since then.

A line chart showing the rate of high-propensity business applications from 2005 to 2024. The number of applications hobers mainly between 90,000 and 120,000 but has a large sprike between 2020 and 2024, where applications soared to between 130,000 and 170,000.
SOURCE: Authors' analysis of data from U.S. Census Bureau, "Business Formation Statistics," data series, June 19, 2024.
NOTE: High-propensity business applications are those that have a high likelihood of becoming businesses with employees on payroll.
To better understand the characteristics and experiences of this emerging class of online entrepreneurs in the United States, RAND partnered with Shopify, a major platform for online businesses that represents around 10 percent of the e-commerce market in the United States and is a growing presence around the world,[2] powering millions of businesses in more than 175 countries. RAND researchers analyzed data about online businesses from Shopify, as well as data from a RAND survey of Shopify business owners, to learn more about business owners' characteristics, their backgrounds, and the key challenges they experience and supports they use while operating their businesses (see the box below for more information on data sources and methods).[3] This brief highlights key insights from that research.
Businesses that use Shopify are predominantly new and small retail- or wholesale-sector businesses. Although firms using the platform vary greatly in size and age, the median firm that was surveyed had annual revenues of around $11,000 via the platform and had been in business for around three years.[4] As shown in Figure 2, 73 percent of these businesses operate entirely online, without physical storefronts, and 28 percent have W-2 employees. For many owners, their online business is a full-time job, but for others it is a part-time gig. Around half of owners (53 percent) work less than 30 hours per week on their businesses.


Business type:
Business staffing:
Time spent on the business:
SOURCE: Authors' analysis of data from RAND's survey of 4,000 businesses active on Shopify.
NOTE: Numbers are percentages.
Business owners who use Shopify look quite different from business owners nationally, including those in similar industries and of similar size. As illustrated in Figure 3, business owners who use Shopify are more likely to be Black (15 percent), female (66 percent), and younger (40 percent) than other entrepreneurs in similar retail and wholesale industries nationwide.
Most of the owners who were surveyed are not serial entrepreneurs. Sixty-nine percent reported that their most-recent jobs prior to owning their current businesses were regular full- or part-time jobs, while only one-quarter described owning other businesses immediately prior to starting their current businesses.
As shown in Figure 4, most owners started their businesses with relatively small amounts of start-up capital; more than half (53 percent) reported needing less than $5,000 in start-up capital to establish their businesses. Business owners frequently reported drawing from their personal savings (82 percent) and/or personal or business credit cards (39 percent) to initially finance their businesses; most did not rely on business loans or investments.

| Demographic | Shopify | ABS and NES retail and wholesale |
|---|---|---|
| Percentage of Black business owners | 15 | 7 |
| Percentage of female business owners | 66 | 44 |
| Percentage of business owners under age 35 | 40 | 17 |
SOURCE: Authors' analysis of data from RAND’s survey of 4,000 businessesactive on Shopify, as well as data from the U.S. Census Bureau'sAnnual Business Survey (ABS) and the U.S. Census Bureau’sNonemployer Statistics (NES) data series.

SOURCE: Authors' analysis of data from RAND’s survey of 4,000 businesses active on Shopify.
NOTE: Owners could select more than one source of financing when asked about financing sources.
Around 70 percent of the entrepreneurs reported that their sales come either directly through their Shopify online store channels or indirectly through other online e-commerce channels. In line with this finding, entrepreneurs most frequently cited online platforms as "very important" supports for their businesses, especially for reaching potential customers (64 percent) and for managing their businesses (43 percent), as shown in Figure 5. Other resources that business owners frequently cited as very important to their businesses were their personal and professional networks (42 percent) and their prior entrepreneurial experiences (37 percent). Other online resources and training were also frequently cited as very important (30 percent).

SOURCE: Authors' analysis of data from RAND's survey of 4,000 businesses active on Shopify.
NOTE: Owners rated each resource on a scale from 1 to 5, where 1 was "not important" and 5 was "very important."
By far the biggest challenge reported by the entrepreneurs pertained to attracting customers (both domestically and internationally); 37 percent cited this aspect as "very challenging," as shown in Figure 6. The next biggest challenges that the entrepreneurs reported were the unpredictability of current business conditions (26 percent) and securing sufficient capital to run their businesses (21 percent). Losing access to other sources of income (19 percent) and, separately, managing taxes and regulations (16 percent) were also cited by a subset of these business owners as very challenging.
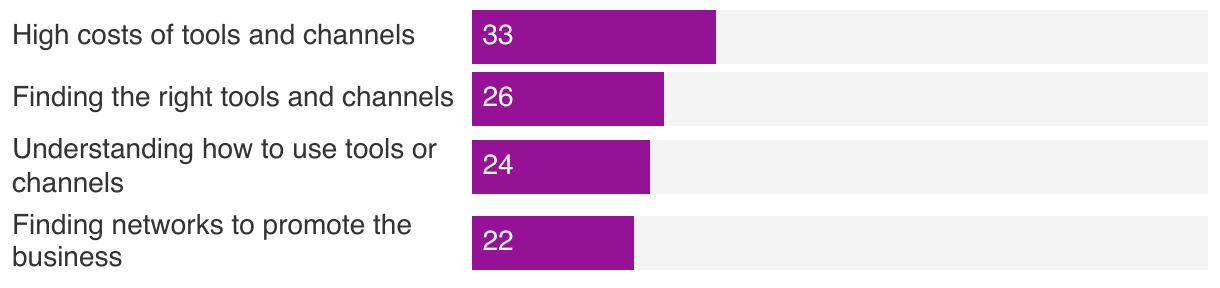
In terms of challenges specifically related to attracting customers, business owners most frequently cited the high costs of tools or marketing channels for reaching potential customers as "very challenging" (33 percent), as shown in Figure 7. Finding the right tools (26 percent), understanding how best to use those tools (24 percent), and finding personal or professional networks to promote their businesses (22 percent) were also significant challenges for many owners.

SOURCE: Authors' analysis of data from RAND's survey of 4,000 businesses active on Shopify.
NOTE: Owners rated each area on a scale from 1 to 5, where 1 was "not a challenge" and 5 was "very challenging." "Attracting customers" combines owners who indicated that attracting customers either domestically or internationally was "very challenging."
The trajectories of online businesses vary, but many of these businesses experienced substantial growth in revenues between their first and second years on the platform. For the analysis, the researchers studied all businesses that first began operating on the platform anytime between 2017 and 2021 and examined their revenues between their first and second years on the platform. As shown in Figure 8, around 50 percent of the businesses had higher annualized sales, 46 percent had the same or lower annualized sales, and 4 percent no longer used the platform as of their second year. Among the firms whose sales on the platform grew, average inflation-adjusted revenue growth was more than 600 percent and median inflation-adjusted revenue growth was 116 percent between their first and second years. The rate of departure from the platform, 4 percent, is low relative to typical rates at which new businesses tend to close after their first year.[5]
Overall, our analyses highlight that many entrepreneurs are successfully using the Shopify platform to help found and grow their businesses, even as they are also contending with key challenges, including reaching customers and securing capital. Analyzing data from Shopify's sample of emerging entrepreneurs is a first step in understanding the health of online businesses, which can help inform the policies that could support new entrants in the e-commerce space.
SOURCE: Authors' analysis of data from RAND's survey of 4,000 businesses active on Shopify.
NOTE: Owners rated each aspect on a scale from 1 to 5, where 1 was "not a challenge" and 5 was "very challenging."

| Firms with higher revenue | Firms with same or lower revenue | Firms exiting the platforme | |
|---|---|---|---|
| Percentage of firms | 50 | 46 | 4 |
| Average change in revenue | +592% | -56% | -100% |
| Median change in revenue | +116% | -58% | -100% |
| Year 1 median revenue | $12.2K | $7.6K | $2.7K |
SOURCE: Authors' analysis of data from Shopify administrative records.
NOTE: The sample consists of 160,634 businesses that first began using the platform anytime between 2017 and 2021 and had at least $1,000 in annualized revenue in their first year on the platform. All dollar amounts are inflation-adjusted to 2022 dollars.

This publication is part of the RAND research brief series. Research briefs present policy-oriented summaries of individual published, peer-reviewed documents or of a body of published work.
This document and trademark(s) contained herein are protected by law. This representation of RAND intellectual property is provided for noncommercial use only. Unauthorized posting of this publication online is prohibited; linking directly to this product page is encouraged. Permission is required from RAND to reproduce, or reuse in another form, any of its research documents for commercial purposes. For information on reprint and reuse permissions, please visit www.rand.org/pubs/permissions.
RAND is a nonprofit institution that helps improve policy and decisionmaking through research and analysis. RAND's publications do not necessarily reflect the opinions of its research clients and sponsors.


